The WPJ
Vacation Real Estate News

Global Report by STR Reveals Most Hotel Markets Posted Positive Performance Gains in June
 According to according to STR Global, many hotel markets around the world posted positive performance results in June, despite lingering economic concerns.
Asia/Pacific Hotel Markets for June 2012
STR Global reports hotels in the Asia/Pacific region experienced positive results in all three key performance metrics for June 2012 when reported in U.S. dollars.
 In year-over-year measurements, the Asia/Pacific region's occupancy increased 1.8 percent to 66.2 percent, its average daily rate increased 5.4 percent to US$136.87 and its revenue per available room was up 7.3 percent to US$90.66.
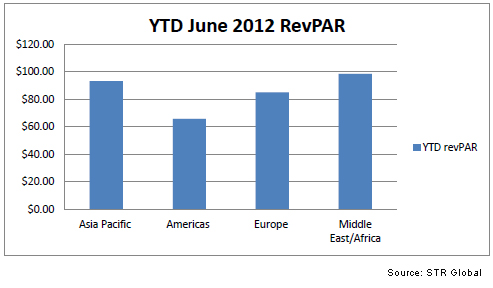
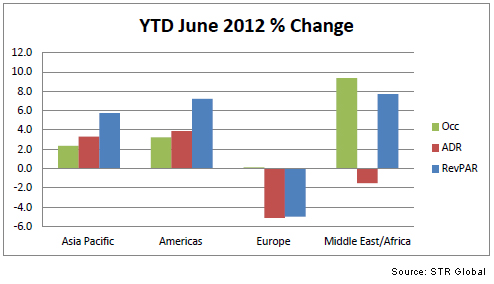
Year-to-date 2012 the region reported a 2.3-percent occupancy increase to 66.0 percent, a 3.3-percent rise in ADR to US$141.38 and a 5.7 percent growth in RevPAR to US$93.26.
"The first six months of 2012 saw overall moderate growth in occupancy and ADR for most months", said Elizabeth Randall, managing director at STR Global. "The increases have helped to bring the region back on par with the first half performance in 2008, before the worldwide financial and economic downturn made its full impact felt. The region matched its 66 percent occupancy and was just US$0.38 below its 2008 first half ADR performance. As the region experienced a continuous increase in new hotel supply, growing with a 3.2 percent compound annual growth rate (CAGR) between the first six months 2008 and 2012, demand has kept pace with a 3.1 percent CAGR".
Highlights from key market performers in June 2012 in local currency (year-over-year comparisons):
- Hanoi, Vietnam, reported the largest occupancy increase, rising 13.1 percent to 61.8 percent, followed by Shanghai, China (+11.3 percent to 62.7 percent), and Phuket, Thailand (+10.2 percent to 59.3 percent).
- Manila, Philippines, fell 6.3 percent in occupancy to 65.2 percent, posting the largest decrease in that metric.
- Three markets experienced ADR increases of more than 20 percent: Jakarta, Indonesia (+26.8 percent to IDR967,559.38); Tokyo, Japan (+22.3 percent to JPY14,796.58); and Taipei, Taiwan (+20.9 percent to TWD6,805.68).
- Delhi, India, reported the largest ADR (-5.6 percent to INR6,520.52) and RevPAR (-10.8 percent to INR3,321.20) decreases for the month.
- Five markets achieved RevPAR increases of more than 20 percent: Jakarta (+31.2 percent to IDR749,897.41); Tokyo (+29.9 percent to JPY11,731.01); Taipei (+28.1 percent to TWD5,015.50); Phuket (+26.3 percent to THB1,875.44); and Kuala Lumpur, Malaysia (+21.1 percent to MYR316.38).
Performances of key countries in June 2012 (all monetary units in local currency):
Highlights from key market performers for June 2012 in U.S. dollars (year-over-year comparisons):
- Tokyo reported the largest ADR increase, up 24.5 percent to US$186.03, followed by Taipei (+16.6 percent to US$227.08) and Jakarta (+15.4 percent to US$102.17).
- Three markets achieved RevPAR increases of more than 20 percent: Tokyo (+32.3 percent to US$147.48); Taipei (+23.6 percent to US$167.35); and Phuket (+22.9 percent to US$59.06).
- Delhi reported the largest ADR decrease, falling 23.8 percent to US$115.97. The market also reported the largest RevPAR decrease, dropping 28.0 percent to US$59.07.
Middle East/Africa
The Middle East/Africa region reported mostly positive performance results in June 2012 when reported in U.S. dollars.
The region's occupancy increased 8.7 percent to 58.2 percent during the month, its average daily rate fell 1.8 percent to US$136.16 and its revenue per available room rose 6.8 percent to US$79.22.
Year-to-date 2012, the region reported a 9.4-percent occupancy increase to 60.6 percent, a 1.5-percent ADR decrease to US$162.37, and a 7.7-percent rise in RevPAR to US$98.38.
"Middle Eastern hoteliers reported improving occupancy and average room rates boosted by double-digit demand growth for the first half of 2012 compared to the first six months in 2011", said Elizabeth Randall, managing director of STR Global. "The occupancy and average room rate for the first half of 2012 is, however, still behind its peak performance of the first six months in 2008. For the first six months of 2008, the region achieved 70.9 percent occupancy and rate of US$235.64. The region saw the highest increase in new room supply compared to the other world regions since 2008. Africa reported continued occupancy improvements whilst average room rates remain under pressure compared to the first half 2011. In contrast, looking back at the first half of 2008, the Africa region surpassed its average room rate performance by US$12.68".
Highlights among the region's key markets for June 2012 include (year-over-year comparisons, all currency in U.S. dollars):
- Muscat, Oman, rose 34.1 percent in occupancy to 51.6 percent, posting the largest increase in that metric, followed by Amman, Jordan, with a 15.0-percent increase to 67.8 percent.
- Doha, Qatar, ended the month with the largest occupancy decrease, falling 11.8 percent to 49.4 percent.
- Dubai, United Arab Emirates, achieved the largest ADR increase, rising 9.8 percent to US$170.07, followed by Amman with an 8.2-percent increase to US$155.51.
- Cape Town, South Africa, fell 15.6 percent in ADR to US$102.93, posting the largest decrease in that metric, followed by Muscat with a 13.3-percent decrease to US$152.90.
- Four markets experienced RevPAR increases of more than 15 percent: Amman (+24.4 percent to US$105.43); Jeddah, Saudi Arabia (18.2 percent to US$195.70); Dubai (+18.0 percent to US$125.25); and Muscat (+16.3 percent to US$78.87).
- Abu Dhabi, United Arab Emirates, fell 15.4 percent in RevPAR to US$66.13, reporting the largest decrease in that metric.
Performances of key countries in June 2012 (all monetary units in local currency):
Europe
The European hotel industry posted mixed results in year-over-year metrics when reported in U.S. dollars, euros and British pounds for June 2012.
Year-over-year, June 2012 figures for Europe (U.S. dollars, euros and British pounds):
Year-to-date 2012, the region's occupancy was virtually flat with a 0.1-percent increase to 63.7 percent, its average daily rate, in euro terms, was up 3.9 percent to EUR103.03, and its revenue per available room increased 4.1 percent to EUR65.64.
"ADR across Europe, in euro terms, continued to grow during June, showing robustness compared to the flatter occupancy performances recently", said Elizabeth Randall, managing director of STR Global. "When comparing the first six months of 2012 to the first half in 2008, there is still ground to be made up. Revenue per available room is still EUR3.61 behind its 2008 first-half performance (EUR69.29). Europe overall saw only a limited increase in room supply, a 1.1-percent compound annual growth rate (CAGR), compared to 0.9% CAGR of demand increase over the last four years".
Highlights from key market performers for June 2012 include (year-over-year comparisons, all currency in euros):
- Frankfurt, Germany, rose 13.3 percent in occupancy to 73.5 percent, posting the largest increase in that metric, followed by Istanbul, Turkey (+12.5 percent to 84.6 percent), and Reykjavik, Iceland (+12.1 percent to 90.5 percent).
- Athens, Greece, fell 19.2 percent in occupancy to 65.6 percent, reporting the largest occupancy decrease.
- Warsaw, Poland, grew 97.4 percent in ADR to EUR158.82, reporting the largest increase in that metric, followed by Frankfurt with a 28.6-percent increase to EUR127.58.
- Milan, Italy (-8.4 percent to EUR123.99), and Zurich, Switzerland (-8.0 percent to EUR197.58), ended the month with the largest ADR decreases.
- Four markets achieved RevPAR increases of more than 25 percent: Warsaw (+98.1 percent to EUR124.34); Frankfurt (+45.8 percent to EUR93.80); Reykjavik (+33.3 percent to EUR113.07); and Istanbul (+28.6 percent to EUR166.68).
- Athens fell 21.2 percent in RevPAR to EUR75.61, posting the largest decrease in that metric, followed by Milan with a 14.5-percent decrease to EUR78.91.
Performances of key countries in June 2012 (all monetary units in local currency):
The Americas
The Americas region recorded positive results in the three key performance metrics when reported in U.S. dollars for June 2012.
The Americas region reported a 4.1-percent increase in occupancy to 70.0 percent, a 4.3-percent gain in average daily rate to US$109.41 and an 8.6-percent jump in revenue per available room to US$76.54.
Among the region's key markets, Los Angeles, California, reported the largest occupancy increase, rising 8.4 percent to 82.9 percent, followed by San Juan, Puerto Rico, with a 6.6-percent increase to 81.7 percent. Occupancy in Panama City, Panama, fell 20.0 percent to 44.5 percent, experiencing the largest decrease in that metric.
Four markets reported ADR growth of more than 10 percent: Rio de Janeiro, Brazil (+21.0 percent to US$245.43); San Francisco, California (+18.5 percent to US$177.89); Santiago, Chile (+12.1 percent to US$165.57); and Boston, Massachusetts (+10.3 percent to US$175.79). Sao Paulo, Brazil (-11.4 percent to US$132.70), and Vancouver, Canada (-10.7 percent to US$142.52), ended the month with the only double-digit ADR decreases.
San Francisco jumped 25.5 percent in RevPAR to US$160.05, achieving the largest increase in that metric, followed by Rio de Janeiro (+25.0 percent to US$176.29) and Los Angeles (+18.7 percent to US$112.02). Three markets posted RevPAR decreases of more than 15 percent: Panama City (-25.7 percent to US$53.45); Vancouver (-16.7 percent to US$105.15); and Sao Paulo (-16.5 percent to US$89.46).
In the first half of 2012 year-to-date, the region's occupancy was up 3.2 percent to 61.1 percent, its ADR grew 3.9 percent to US$107.75 and its RevPAR increased 7.2 percent to US$65.81.
Performances of key countries in June 2012 (all monetary units in local currency):
Real Estate Listings Showcase


This website uses cookies to improve user experience. By using our website you consent in accordance with our Cookie Policy. Read More