The WPJ
Residential Real Estate News

U.S. Home Prices Continued to Decline in November, Third Consecutive Month Says Case-Schiller Index
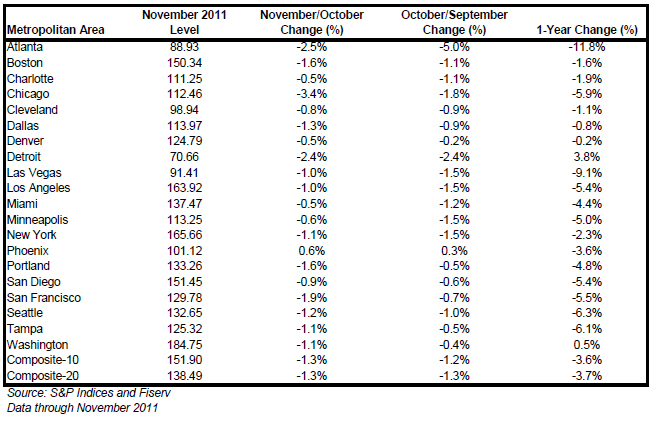
According to S&P/Case-Shiller's latest Home Price Indices, U.S. home prices declined 1.3% for both the 10- and 20-City Composites in November over October. For a second consecutive month, 19 of the 20 cities covered by the indices also saw home prices decrease.
The 10- and 20-City Composites posted annual negative returns of -3.6% and -3.7% versus November 2010, respectively. These are worse than the 3.2% and 3.4% respective rate declines reported for October. In addition to both Composites, 13 of the 20 MSAs saw their annual returns decrease compared to October's data.
New York and Tampa saw no change in annual returns in November; while Charlotte, Cleveland, Denver, Minneapolis and Phoenix saw their annual rates improve. At -11.8% Atlanta continued to post the lowest annual return. Detroit and Washington DC were the only two cities to post positive annual returns of +3.8% and +0.5%, respectively, in November. While positive, both cities saw these annual rates fall versus October's data.
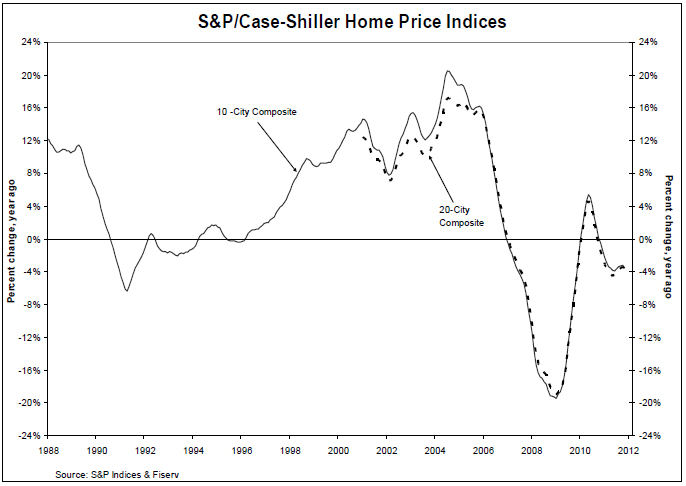
The chart above depicts the annual returns of the 10-City and the 20-City Composite Home Price Indices. In November 2011, the 10- and 20-City Composites recorded annual returns of -3.6% and -3.7%, respectively. Both Composites and 13 MSAs - Atlanta, Boston, Chicago, Dallas, Detroit, Las Vegas, Los Angeles, Miami, Portland, San Diego, San Francisco, Seattle, and Washington DC - saw their annual rates worsen in November compared to October.
"Despite continued low interest rates and better real GDP growth in the fourth quarter, home prices continue to fall. Weakness was seen as 19 of 20 cities saw average home prices decline in November over October," says David M. Blitzer, Chairman of the Index Committee at S&P Indices. "The only positive for the month was Phoenix, one of the hardest hit in recent years. Annual rates were little better as 18 cities and both Composites were negative. Nationally, home prices are lower than a year ago. The 10-City Composite was down 3.6% and the 20-City was down 3.7% compared to November 2010. The trend is down and there are few, if any, signs in the numbers that a turning point is close at hand.
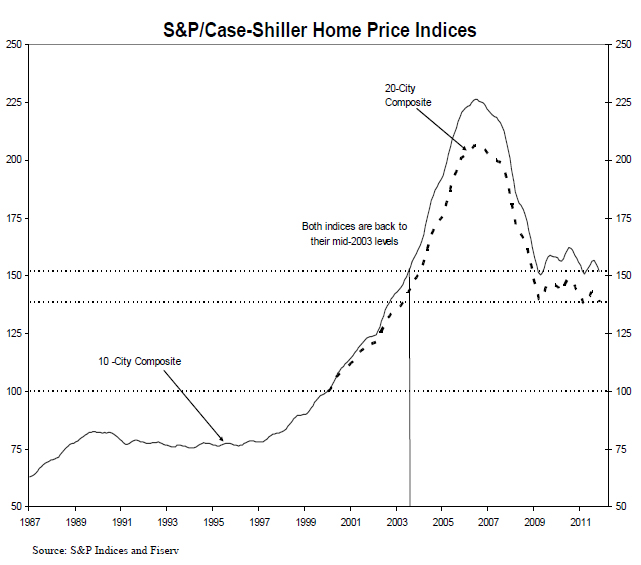
"The crisis low for the 10-City Composite was April 2009; for the 20-City Composite the more recent low was March 2011. The 10-City Composite is now about 1.0% above its low, and the 20-City Composite is only 0.6% above its low. From their 2006 peaks, both Composites are down close to 33% through November.
"Atlanta continues to stand out in terms of recent relative weakness. It was down 2.5% over the month, after having fallen by 5.0% in October, 5.9% in September and 2.4% in August. It also posted the weakest annual return, down 11.8%. In addition, Atlanta, Las Vegas, Seattle and Tampa all reached new lows in November."
The chart above shows the index levels for the 10-City and 20-City Composite Indices. As of November 2011, average home prices across the United States are back to the levels where they were in mid-2003. Measured from their June/July 2006 peaks through November 2011, the peak-to-current decline for both the 10-City Composite and 20-City Composite is -32.9%. The recovery from recent lows are +1.0% and +0.6%, respectively.
As in October 2011, Phoenix was the only MSA that posted a monthly gain, +0.6% in November. Both the 10-City and 20-City Composites were down 1.3%, from their October 2011 levels. Atlanta, Cleveland, Detroit and Las Vegas were the four cities where average home prices were below their January 2000 levels.
Real Estate Listings Showcase


This website uses cookies to improve user experience. By using our website you consent in accordance with our Cookie Policy. Read More