The WPJ
Residential Real Estate News

Rate of U.S. Home Price Declines Slowed in Q1, Showing Signs of Stabilization in Some Markets
 Based on the latest S&P/Case-Shiller Home Price Indices report, all three key price composites ended the first quarter of 2012 at new post-crisis lows.
The national composite fell by 2.0% in the first quarter of 2012 and was down 1.9% versus the first quarter of 2011.
The 10- and 20-City Composites posted respective annual returns of -2.8% and -2.6% in March 2012. Month-over-month, their changes were minimal; average home prices in the 10-City Composite fell by 0.1% compared to February and the 20-City remained basically unchanged in March over February. However, with these latest data, all three composites still posted their lowest levels since the housing crisis began in mid-2006.
In addition to the three composites, five cities - Atlanta, Chicago, Las Vegas, New York and Portland - also saw average home prices hit new lows. This is an improvement over the nine cities reported last month.
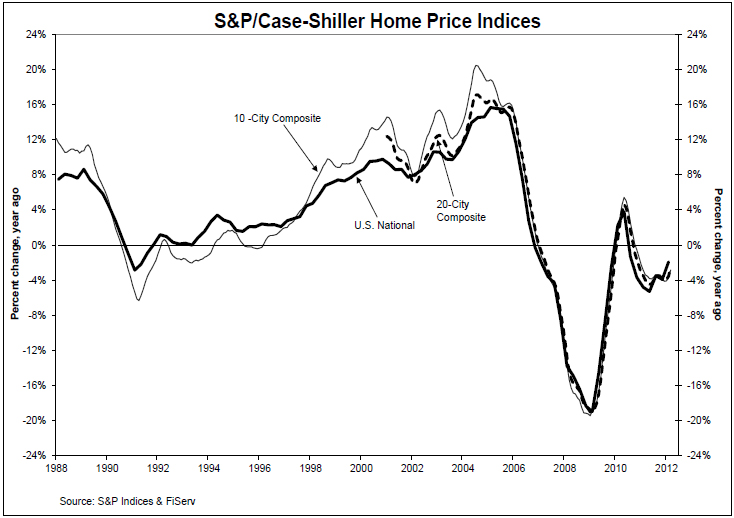
The chart above depicts the annual returns of the U.S. National, the 10-City Composite and the 20-City Composite Home Price Indices. The S&P/Case-Shiller U.S. National Home Price Index, which covers all nine U.S. census divisions, posted a 1.9% decline in the first quarter of 2012 over the first quarter of 2011. In March 2012, the 10- and 20-City Composites recorded annual rates of decline of 2.8% and 2.6%, respectively.
"While there has been improvement in some regions, housing prices have not turned," says David M. Blitzer, Chairman of the Index Committee at S&P Indices. "This month's report saw all three composites and five cities hit new lows. However, with last month's report nine cities hit new lows. Further, about half as many cities, seven, experienced falling prices this month compared to 16 last time.
"The National Composite fell by 2.0% in the first quarter alone, and is down 35.1% from its 2nd quarter 2006 peak, in addition to recording a new record low. The 10- and 20-City Composite mimic these results; also down about 35% from their relative peaks and hit new lows.
"There are some better numbers: Only three cities - Atlanta, Chicago and Detroit - saw annual rates of change worsen in March. The other 17 cities and both composites saw improvement in this statistic, even though most are still showing a negative trend. Moreover, there are now seven cities - Charlotte, Dallas, Denver, Detroit, Miami, Minneapolis and Phoenix - where the annual rates of change are positive. This is what we need for a sustained recovery; monthly increases coupled with improving annual rates of change. Once we see this on a broader level we will be able to say the market has turned around.
"The regions showed mixed results for March. Twelve of the cities saw average home prices rise in March over February, seven saw prices fall and one - Las Vegas - was flat. The Composites were largely unchanged with the 10-City down only 0.1% and the 20-City unchanged. After close to six consecutive months of price declines across most cities, this is relatively good news. We just need to see it happen in more of the cities and for many months in a row. Since we are entering a seasonal buying period, it becomes very important to look at both monthly and annual rates of change in home prices in order to understand the broader trend going forward."
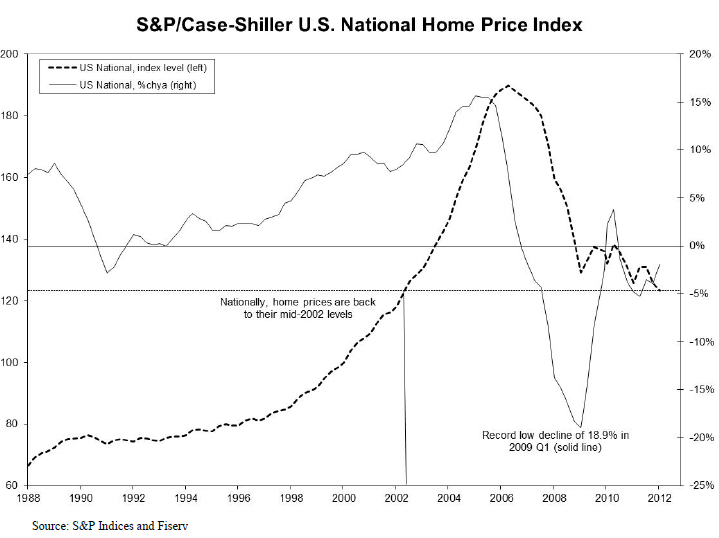
The chart above shows the index levels for the U.S. National Home Price Index, as well as its annual returns. As of the first quarter of 2012, average home prices across the United States are back at their mid-2002 levels. With this report, the National Index level hit a new low, down 2.0% over the first quarter of 2012 and 1.9% below the first quarter of 2011.
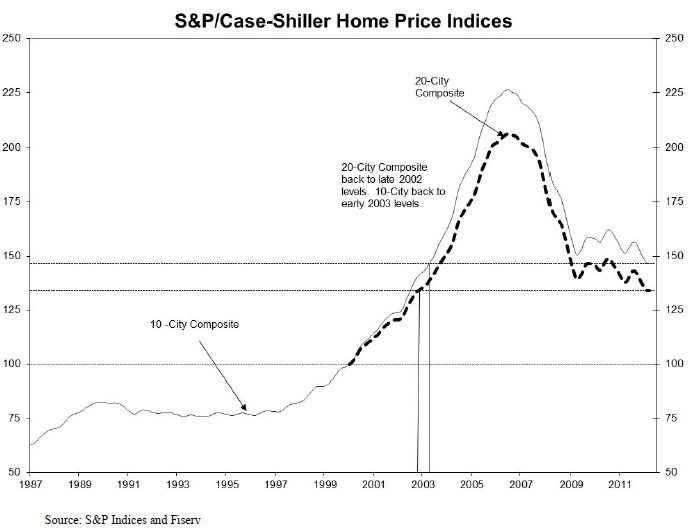
The chart above shows the index levels for the 10-City and 20-City Composite Indices. As of March 2012, average home prices across the United States are back to the levels where they were in late 2002 for the 20-City Composite and early 2003 levels for the 10-City Composite. Measured from their June/July 2006 peaks, the decline for both Composites is approximately 35% through March 2012. For both Composites, March's levels are new lows in the current housing cycle.
In March 2012, 12 MSAs posted monthly gains, seven declined and one remained unchanged. Phoenix posted the largest annual rate of change, +6.1%, while home prices in Atlanta fell the most over the year, down 17.7%.
Atlanta, Cleveland, Detroit and Las Vegas were the four cities where average home prices were below their January 2000 levels. With an index level of 102.77 Chicago is not far behind.
Real Estate Listings Showcase


This website uses cookies to improve user experience. By using our website you consent in accordance with our Cookie Policy. Read More