The WPJ
Residential Real Estate News

S&P/Case-Shiller Home Price Index Reports All Three Home Price Composites End 2011 at New Lows
According to the latest S&P/Case-Shiller Home Price Indices report for December 2011, U.S. home prices ended 2011 at new index lows.
The national composite fell by 3.8% during the fourth quarter of 2011 and was down 4.0% versus the fourth quarter of 2010. Both the 10- and 20-City Composites fell by 1.1`% in December over November, and posted annual returns of -3.9% and -4.0% versus December 2010, respectively. These are worse than the -3.8% respective annual rates both reported for November. With these latest data, all three composites are at their lowest levels since the housing crisis began in mid-2006.
Key Report Highlights Include:
- The national composite fell by 3.8% during the fourth quarter of 2011 and was down 4.0% versus the fourth quarter of 2010.
- Both the 10- and 20-City Composites fell by 1.1`% in December over November, and posted annual returns of -3.9% and -4.0% versus December 2010.
- All three composites are at their lowest levels since the housing crisis began in mid-2006.
- 18 of the 20 MSAs saw monthly declines in December over November.
In addition to both Composites, 18 of the 20 MSAs saw monthly declines in December over November. Miami and Phoenix were up 0.2% and 0.8%, respectively. At -12.8% Atlanta continued to post the lowest annual return. Detroit was the only city to post a positive annual return, +0.5% in December versus the same month in 2010. In addition to the three composites, Atlanta, Las Vegas, Seattle and Tampa each saw average home prices hit new lows.
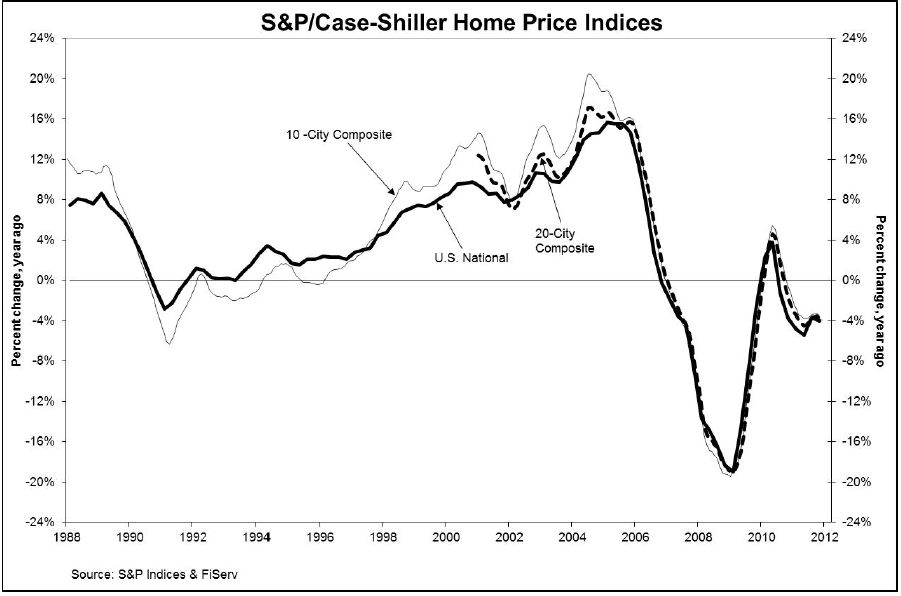
The chart above depicts the annual returns of the U.S. National, the 10-City Composite and the 20-City Composite Home Price Indices. The S&P/Case-Shiller U.S. National Home Price Index, which covers all nine U.S. census divisions, recorded a 4.0% decline in the fourth quarter of 2011 over the fourth quarter of 2010. In December, the 10- and 20-City Composites posted annual rates of decline of 3.9% and 4.0%, respectively.
"In terms of prices, the housing market ended 2011 on a very disappointing note," says David M. Blitzer, Chairman of the Index Committee at S&P Indices. "With this month's report we saw all three composite hit new record lows. While we thought we saw some signs of stabilization in the middle of 2011, it appears that neither the economy nor consumer confidence was strong enough to move the market in a positive direction as the year ended.
"After a prior three years of accelerated decline, the past two years has been a story of a housing market that is bottoming out but has not yet stabilized. Up until today's report we had believed the crisis lows for the composites were behind us, with the 10-City Composite originally hitting a low in April 2009 and the 20-City Composite in March 2011. Now it looks like neither was the case, as both hit new record lows in December 2011. The National Composite fell by 3.8% in the fourth quarter alone, and is down 33.8% from its 2nd quarter 2006 peak. It also recorded a new record low.
"In general, most of the regions also posted weak data in December. Eighteen of the cities saw average home prices fall in December over November. Seventeen of the cities have seen monthly declines for at least three consecutive months. In addition to both monthly composites, 10 of the cities saw home prices fall by more than 1.0% during the month of December. The pick-up in the economy has simply not been strong enough to keep home prices stabilized. If anything it looks like we might have reentered a period of decline as we begin 2012."
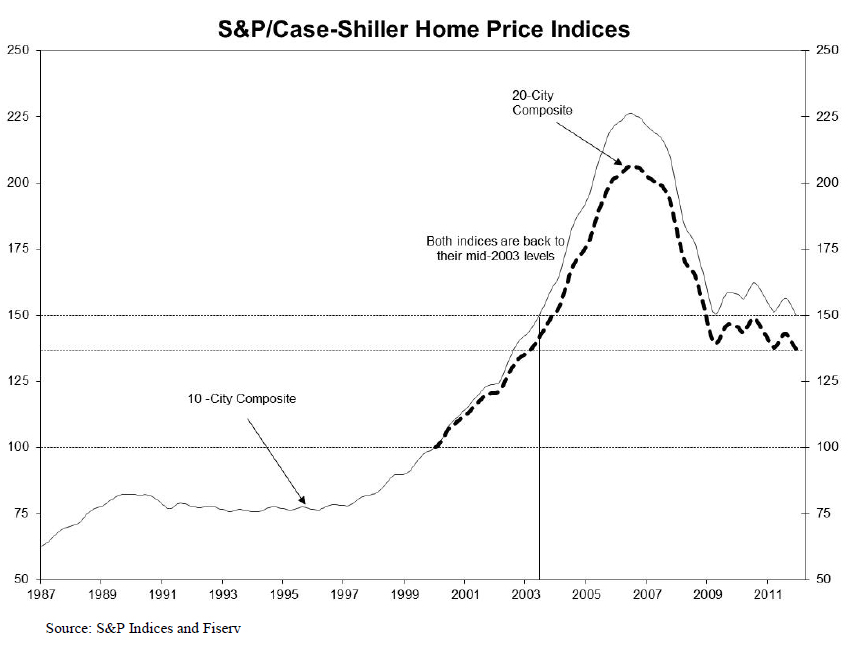
The chart above shows the index levels for the U.S. National Home Price Index, as well as its annual returns. As of the fourth quarter of 2011, average home prices across the United States are back at their late 2002 levels. With this month's report, the National Index level hit a new low, falling 3.8% over the 4th quarter and down 4.0% versus the fourth quarter of 2010.
The chart above shows the index levels for the 10-City and 20-City Composite Indices. As of December 2011, average home prices for these two composites hit new record lows. Measured from their June/July 2006 peaks through December 2011, the peak-to-current decline for both the 10-City Composite and 20-City Composite is -33.8%; the same as the national composite.
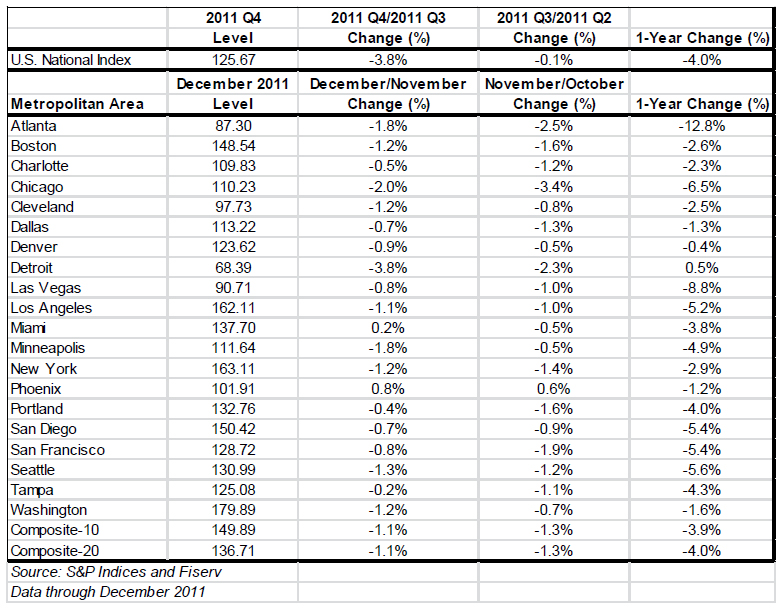
The table above summarizes the results for December 2011. The S&P/Case-Shiller Home Price Indices are revised for the 24 prior months, based on the receipt of additional source data.
In December 2011, Miami and Phoenix were the only two MSAs that posted monthly gains, +0.2% and +0.8%, respectively. Both the 10-City and 20-City Composites were down 1.1%, from their November 2011 levels. Atlanta, Cleveland, Detroit and Las Vegas were the four cities where average home prices were below their January 2000 levels. With an index level of 101.91 Phoenix is not far behind.
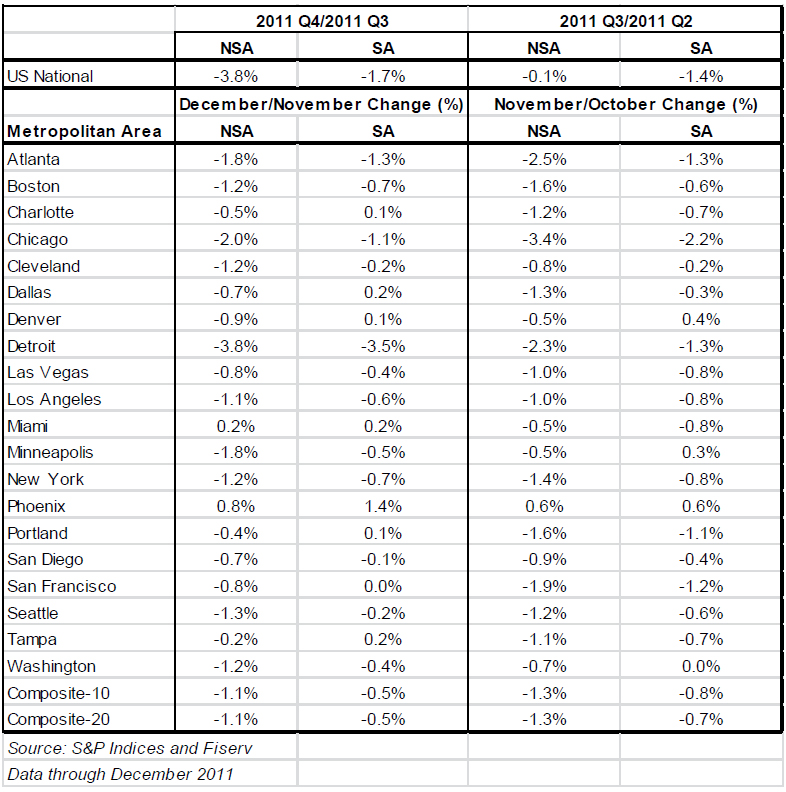
Since its launch in early 2006, the S&P/Case-Shiller Home Price Indices have published, and the markets have followed and reported on, the non-seasonally adjusted data set used in the headline indices. For analytical purposes, S&P Indices publishes a seasonally adjusted data set covered in the headline indices, as well as for the 17 of 20 markets with tiered price indices and the five condo markets that are tracked.
A summary of the monthly changes using the seasonally adjusted (SA) and non-seasonally adjusted (NSA) data can be found in the table below.
Real Estate Listings Showcase


This website uses cookies to improve user experience. By using our website you consent in accordance with our Cookie Policy. Read More