The WPJ
Residential Real Estate News

The Hamptons, North Fork Home Sales Slightly Uptick in Q1, Luxury Sales Providing Lift
According to a new report by Manhattan-based Prudential Douglas Elliman for the Hamptons and North Fork markets, pricing indicators started showing overall market stability in Q1, 2012.
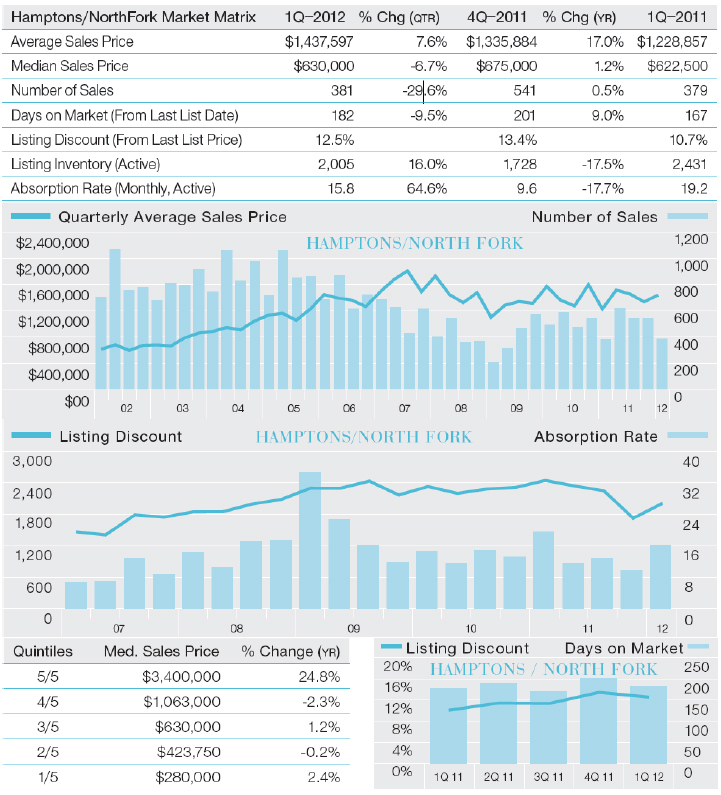
The median home sales price edged 1.2% higher to $630,000 over the prior year quarter. The average sales price jumped 17% due to improved conditions at the high end.
The number of sales was stable, while inventory fell sharply. There were 381 sales, a nominal 0.5% increase over 379 sales in the prior year quarter. Listing inventory fell 17.5% to 2,005 from 2,431 over the same period.
Listing discounts and days on market also expanded. Despite the drop in inventory, listing discount expanded by nearly 2% and days on market expanded by more than two weeks.
The median sales price edged up 1.2% to $630,000 from $622,500 in the prior year quarter. Average sales price increased 17% to $1,437,597 from $1,228,857 over the same period, largely due to continued strength at the upper end of the market. In the median sales price by quintile analysis, the fifth quintile increased 24.8% year-over- year, while the remainder of the market segments showed modest change and mixed results over the same period.
The number of sales posted a nominal 0.5% increase to 381 sales from 379 sales in the prior year quarter. Despite the stability in sales activity, the number of properties available for sale fell sharply. There were 2,005 properties listed for sale, 17.5% less than 2,431 listings in the prior year quarter. As a result, the monthly absorption rate, or the number of months to sell all available properties at the current pace of sales, fell to 15.8 months from 19.2 months over the same period. Although the level of sales remained consistent with prior year levels and listing inventory fell sharply, other related metrics weakened.
Days on market, the number of days from the last price change to contract date, was 182 days, more than two week longer than 167 days in the prior year quarter. Listing discount, the percentage difference between the list price at time of contract and the sales price, increased to 12.5% from 10.7% in the prior year quarter. The Hamptons and the North Fork housing markets have continued to show overall stability for the past two years, along with continued strength at the upper end of the market.
North Fork Market
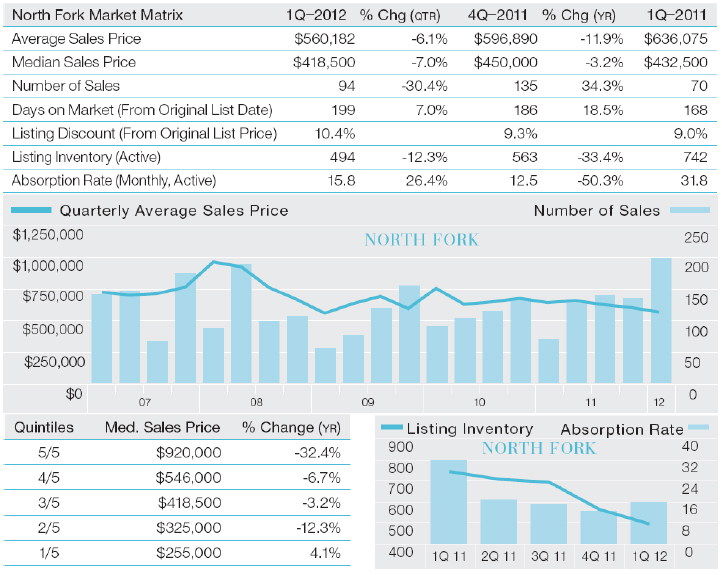
- Number of sales above prior year levels and at highest first quarter total in five years-- There were 94 sales in the first quarter, 34.3% more than 70 sales in the prior year quarter.
- Price indicators fell below same period last year-- Median sales price was $418,500, 3.2% below $432,500 in the same period last year. Average sales price declined 11.9% to $560,182 over the same period.
- Listing inventory fell sharply -- The number of properties available for sale fell 33.4% to 494 from 742 in the same quarter last year.
There were 94 sales in the first quarter, 34.3% more than 70 sales in the prior year quarter. Seasonally, the first quarter typically yields the lowest total number of sales for any given year; however, 2012 had the highest first quarter sales total since the onset of the credit crunch five years ago. Listing inventory fell sharply over the same period to 494 listings, 33.4% less than 742 listings in the prior year quarter.
The sharp decline in inventory and increase in sales resulted in a 50.3% decline in the monthly absorption rate to 15.8 months from 31.8 months in the prior year quarter. The North Fork accounted for 24.7% of all East End sales and 9.6% of all sales dollars in the first quarter, compared to 18.5% of sales and the same market share of volume in the prior year quarter.
The average unit market share of the East End was consistent with the 24.4% five-year North Fork market share average. With a growing concentration of high-end sales to the south, the volume market share was below the 11.8% five-year average. Despite the sharp decline in listing inventory and corresponding decline in the monthly absorption rate, the related metrics, such as days on market and listing discount, suggested a market slow down. The average number of days to market a property was 199, more than one month slower than the 168-day average in the prior year quarter. Listing discount expanded to 10.4% from 9% over the same period.
Median sales price declined 3.2% to $418,500 from $432,500 in the prior year quarter. Average sales price showed the same pattern, falling 11.9% to $560,182 from $636,075 in the prior year quarter. The top four quintiles posted declines in median sales price, with the greatest decline realized in the top quintile. The fifth quintile declined 32.4% to $920,000 from $1,360,000 in the prior year quarter.
The fourth, third and second quintiles declined 6.7%, 3.2% and 12.3% in median sales price, respectively. Conversely, the first quarter increased 4.1% to $255,000 from $245,000 over the same period as a result of the drop in mortgage rates to record lows. The entry-level or lower-priced housing markets tend to be more immediately responsive to sudden changes in mortgage rates.
Hamptons Market
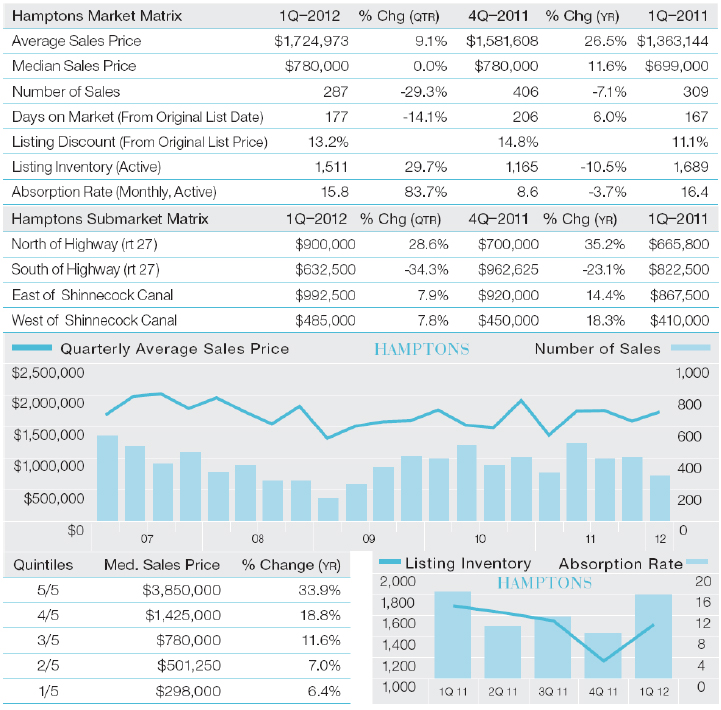
- Price indicators above prior year levels-- Median sales price increased 11.6% to $780,000 from $699,000 in the same period last year. Greater price strength in the higher quintiles helped push the overall indicators higher.
- Both the number of sales and inventory declined-- There were 287 sales, 7.1% less than 309 sales in the prior year quarter. Listing inventory dropped 10.5% to 1,511 from 1,689 over the same period.
- Days on market edged higher-- The average time to sell a property increased to 177 days, 10 days longer than the prior year quarter.
There were 287 sales in the first quarter, the lowest quarterly total in more than two years, which is somewhat surprising, given the mild winter weather.
The first quarter total was 7.1% below 309 sales in the prior year quarter. Listing inventory dropped 10.5% to 1,511 from 1,689 over the same period. The decline in inventory outpaced the decline in sales, resulting in a drop in the monthly absorption rate to 15.8 months from 16.4 months in the prior year quarter.
Despite having fewer listings available, the average number of days to sell a property was 177, 10 days longer than 167 days in the prior year quarter. Listing discount expanded to 13.2% in the first quarter, up from 11.1% in the same period last year. Price indicators expanded above the prior year quarter, as the upper end of the market outperformed the overall market. Median sales price increased 11.6% to $780,000 from $699,000 in the prior year quarter.
The 2010 surge in closings at the upper end of the market from concern over the expiration of the Bush tax cuts likely caused an unusually low median sales price in the first quarter of 2011. The median sales price was unchanged from $780,000 in the prior quarter.
The four sub-markets determined by relative orientation to Route 27 and the Shinnecock Canal reflected the same general shift in mix toward the high-end. The only region to see a year-over-year decline in median sales price was south-of-the-highway, which posted a 23.1% decline to $632,500 from $822,500 in the same period last year. The region north of the highway and both east and west of the canal showed double-digit gains in there, respectively pricing indicators of 35.2%, 14.4% and 18.3%.
Condo Market
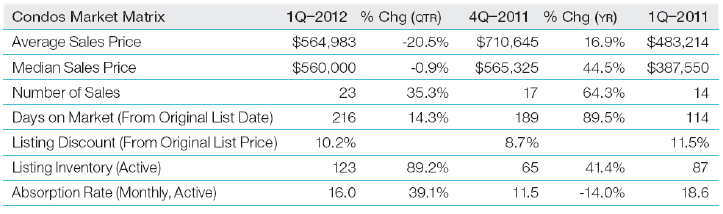
- The absorption rate was faster-- With sales rising faster than inventory, the absorption rate fell to 16 months, 2.6 months faster than the prior year quarter.
- Price indicators showed double digit growth-- Median sales price surged 44.5% to $560,000 from $387,550 in the prior year quarter from shift in mix.
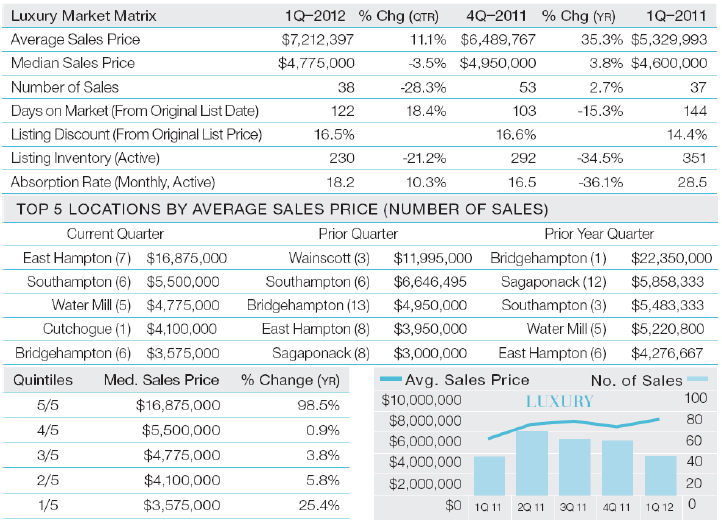
Luxury Market
- Price indicators showed year-over-year gains-- Median sales price edged 3.8% higher to $4,775,000 from $4,600,000 in the same period last year. Average sales price was up 35.3% over the same period.
- Luxury market began at second highest level in history-- The bottom of the top ten percent began at $3,400,000 in the first quarter, 22% higher than $2,787,500 in the prior year quarter and second only to $3,450,000 in the same period two years ago.
- Listing inventory and days on market fell sharply-- The number of listings fell 34.5% to 230 from 351 in the prior year quarter. The average time to market a luxury property was 122 days, two months faster than 182 days in the overall market and three weeks faster than in the prior year quarter.
Real Estate Listings Showcase


This website uses cookies to improve user experience. By using our website you consent in accordance with our Cookie Policy. Read More