The WPJ
Residential Real Estate News

Home Flipping Trend in U.S. Declines, Yet ROI Improves in Q2
RealtyTrac is now reporting that 30,013 single family homes were flipped in the U.S. -- homes sold as part of an arms-length sale for the second time within a 12-month period -- in the second quarter, 4.5 percent of all single family home sales during the quarter.
According to RealtyTrac's Q2 2015 U.S. Home Flipping Report, the 4.5 percent share of second quarter home sales that were flips was down from 5.5 percent in the previous quarter and down from 4.9 percent a year ago. Going back to the first quarter of 2000, the peak in flipping was in the first quarter of 2006, when 8.0 percent of all single family home sales were flips.
The average gross profit -- the difference between the purchase price and the flipped price (not including rehab costs and other expenses incurred, which flipping experts estimate typically run between 20 percent and 33 percent of the property's after repair value) -- for completed flips in the second quarter was $70,696, up from $67,753 in the previous quarter and up from $49,842 a year ago.
The average gross return on investment (ROI) -- the average gross profit as a percentage of the average original purchase price -- was 35.9 percent for completed flips in the second quarter, up slightly from 35.6 percent in the first quarter and up from 23.4 percent a year ago. The average gross ROI on flips reached a 10-year peak of 44.9 percent in Q2 2013.
"Despite the rise in flipping returns in the second quarter, home flippers should proceed with caution in the next six to 12 months as home price appreciation slows and a possible interest rate increase could shrink the pool of prospective buyers for fix-and-flip homes," said Daren Blomquist, vice president at RealtyTrac. "While average flipping returns are up substantially from a year ago at the national level and in moderately-priced markets such as Miami, Atlanta, Phoenix and Minneapolis, flipping returns are softening in some of the higher-priced markets such as San Francisco, Seattle, Denver and Los Angeles,"
"The fewer foreclosure deals and longer flipping timelines that we see in the data demonstrate that flippers are getting squeezed on both sides of the profit equation," Blomquist continued. "Experienced flippers will often need to enter into higher-risk markets with less solid economic fundamentals to chase better yields. Flipping is not always profitable, as evidenced by the fact that flips on low-end homes priced below $50,000 actually yielded negative returns in the second quarter."
Markets with highest share of flipped homes
Among metropolitan statistical areas with at least 50 completed single family home flips in the second quarter, those where flips accounted for the highest percentage of all home sales were Fernley, Nevada (11.4 percent), Miami, Florida (9.6 percent), Palm Coast, Florida (9.2 percent), Memphis, Tennessee (9.0 percent), Tampa, Florida (8.9 percent), Deltona, Florida (8.7 percent), and Sarasota, Florida (8.1 percent).
"Even with our strong rise in prices, investors remain savvy and are enjoying continued success with increased profits per flipped home in South Florida," said Mike Pappas, CEO and president of Keyes Company, covering the South Florida market. "They saw an 18 percent rise in gross profits over last year to an impressive $82,042 average increase in value with a 175-day hold. "Flipped homes are now under 10 percent of our overall market dropping 7 percent from last year. However, our long process of foreclosure due to our judicial state bodes well for the serious investor for the next few years."
Among zip codes with at least 15 completed single family home flips in the second quarter, those where flips accounted for the highest share of total single family sales were 62206 in East Saint Louis, Illinois (39.3 percent); 33056 in Opa Locka, Florida in the Miami metro area (34.5 percent); 89104 in Las Vegas (33.3 percent); 48021 in Eastpointe, Michigan in the Detroit metro area (33.2 percent); and 48089 in Warren, Michigan in the Detroit metro area (31.2 percent).
Other major metro areas where the share of homes flipped in the second quarter was above the national average included Las Vegas, Nevada (7.7 percent); Detroit, Michigan (7.1 percent); Baltimore (7.1 percent); Los Angeles (7.0 percent); Orlando (6.8 percent); Phoenix (6.7 percent); and Jacksonville, Florida (6.7 percent).
"Flips are still a relevant and interesting segment in our marketplace," said Mark Hughes, chief operating officer with First Team Real Estate, covering the Southern California market. "Gross profits in dollars continue to rise with more efficient renovation technologies and work flows, and the uptick in market activity just adds fuel to the flip dynamic, too. One of the problems with a high-priced market like Southern California is that you can get into a multiple-offer situation making the acquisition price rise further. Most of the high-end flippers in our area are betting on up-and-coming neighborhoods where they don't expect to make a profit for two to five years."
Among zip codes with at least 15 completed single family home flips in the second quarter, those with the highest average flipped price were 95125 in San Jose ($1,953,033); 90065 in Los Angeles ($716,656); 85018 in Phoenix ($679,040); 33134 in Miami ($561,447); and 97202 in Portland ($548,903). There were a total of 211 zips with an average flipped price above $1 million, but the majority of those had fewer than 15 total homes flipped in the second quarter.
Markets with the highest average returns on flipped homes
Among markets with at least 50 completed single family home flips in the second quarter, those with the highest average gross ROI were Chicago, Illinois (61.2 percent), Dayton, Ohio (60.6 percent), Harrisburg, Pennsylvania (60.6 percent), Ocala, Florida (56.8 percent) and Baltimore, Maryland (56.7 percent).
"With low available inventory, increasing sales prices, and low days on market, communities across Ohio are offering greater profit opportunities for investors looking to flip real estate investment properties in 2015," said Michael Mahon, president at HER Realtors, covering the Cincinnati, Dayton and Columbus markets in Ohio. "As competition has continued to increase with large Wall Street investment trusts and individual investors competing for the same inventory, the difficult task has been finding potential properties to invest."
Among zip codes with at least 15 completed single family home flips in the second quarter, those with the highest average gross return on investment were 32209 in Jacksonville, Florida (231.9 percent); 45424 in Dayton, Ohio (189.5 percent); 21215 in Baltimore (163.5 percent); 63116 in Saint Louis (161.1 percent); and 38127 in Memphis (141.4 percent).
Metro areas with the highest average gross profits in dollars on completed single family home flips in the second quarter were San Jose ($261,946), Los Angeles ($171,954), San Diego ($141,483), Washington, DC ($139, 927) and Seattle ($131,028).
"Although there was a drop in flipping in the second quarter, the trend is still upward," said Matthew Gardner, chief economist at Windermere Real Estate, covering the Seattle market. "Clearly, the market is still strong for renovators, which is actually not surprising given the remarkably low levels of inventory in the Seattle market. Demand is still well ahead of supply. Even with further anticipated price growth in the Seattle market, I still believe that there is enough upside potential for "flippers" to make the margins necessary for them to continue to buy."
Average time to flip increases to 179 days, an eight-year high
Homes that were flipped in the second quarter took an average of 179 days to complete the flip process -- between the first and second purchases -- up from 173 days in the first quarter and up from 175 days in the second quarter of 2014. The 179-day average for homes flipped in the second quarter was the longest for any quarter going back to Q2 2007, an eight-year high.
Among markets with at least 50 completed home flips in the second quarter, those with the longest average time to flip were Hartford, Connecticut (225 days), Fayetteville, Arkansas (218 days), Greeley, Colorado (215 days), New York, New York (211 days), Little Rock, Arkansas (204 days) and Chicago, Illinois (204 days). The average time to complete a home flip increased in five of these six these metro areas compared to a year ago. The only exception was Chicago, where the average time to complete a flip a year ago was 204 days.
On the other end, markets where flips completed in the second quarter took the shortest on average were Memphis, Tennessee (134 days), Birmingham, Alabama (138 days), Detroit, Michigan (141 days), St. Louis, Missouri (142 days), and Fernley, Nevada (144 days). The average time to complete a flip increased from a year ago in Memphis, Tennessee, but decreased from a year ago in the other four markets with the shortest average time to flip.
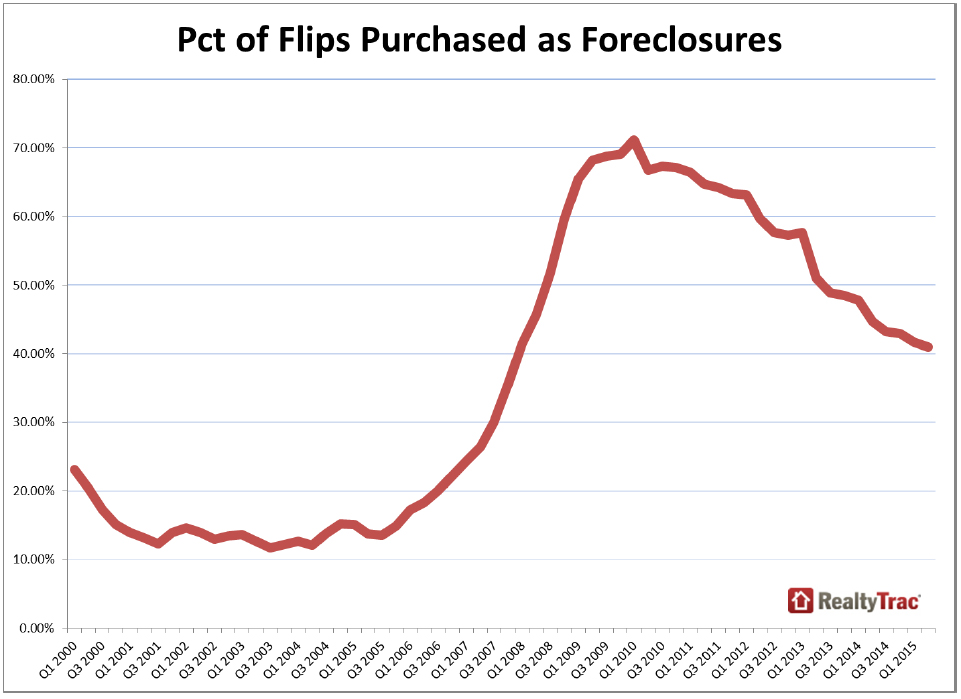
Flipped homes acquired in foreclosure at 30-month low
Of the 30,013 single family homes flipped in the second quarter, 12,305 (41.0 percent) were acquired by the person or entity flipping the home while the home was in some stage of foreclosure, down from 41.6 percent in the previous quarter and down from 44.7 percent in the second quarter of 2014. The 41 percent share of flips acquired in foreclosure was down from a peak of 71.1 percent in the first quarter of 2010 and at the lowest level since the fourth quarter of 2007, when 35.5 percent of flips were acquired in foreclosure.
Among metropolitan statistical areas with at least 50 flipped single family homes in the second quarter, those with the highest share of flips acquired in foreclosure were Palm Coast, Florida (70.4 percent), Punta Gorda, Florida (67.9 percent), Cleveland (61.5 percent), Palm Bay-Melbourne-Titusville, Florida (61.3 percent), and Miami (61.1 percent).
Markets with the lowest share of Q2 flips acquired in foreclosure were Pittsburgh (15.9 percent), San Jose (16.6 percent), Fort Collins-Loveland, Colorado (16.9 percent), Harrisburg, Pennsylvania (17.0 percent) and Oklahoma City (21.8 percent).
Best returns on homes sold between $100,000 and $200,000, $2 million to $5 million
Completed second quarter flips with a flipped price between $100,000 and $200,000 yielded an average gross ROI of 44 percent -- the highest of any price range -- followed by those with a flipped price between $2 million and $5 million, which generated an average gross ROI of 43 percent.
Completed second quarter flips with a flipped price of less than $50,000 actually generated a gross ROI that was negative 12 percent -- the worst return of any price range -- followed by those with a flipped price between $750,000 and $1 million, which generated an average gross ROI of 18 percent.
Real Estate Listings Showcase


This website uses cookies to improve user experience. By using our website you consent in accordance with our Cookie Policy. Read More