The WPJ
Residential Real Estate News

U.S. Home Prices Rise in April, But at Slower Pace
According to the latest S&P/Case-Shiller Home Price Index, U.S. home prices continued their rise in April across the country over the last 12 months, but the upward pace of price appreciation slowed.
Year-over-Year
Both Composites and the National index showed slightly lower year-over-year gains compared to last month. The 10-City Composite gained 4.6% year-over-year, while the 20-City Composite gained 4.9% year-over-year. The S&P/Case-Shiller U.S. National Home Price Index, covering all nine U.S. census divisions, recorded a 4.2% annual gain in April 2015 versus a 4.3% increase in March 2015.
Denver and San Francisco reported the highest year-over-year gains with price increases of 10.3% and 10.0%, respectively, over the last 12 months. Dallas reported an 8.8% year-over-year gain to round out the top three cities. Nine cities reported faster price increases in the year ended April 2015 over the year ended March 2015. Las Vegas prices rose 6.3% in the year to April versus 5.7% in the year to March 2015. In 11 cities, however, the rate of annual price gains slowed. Boston home prices were up 1.8% in the 12 months ending in April compared to a 4.6% gain in the 12 months ending in March 2015.
Month-over-Month
Before seasonal adjustment, the National index increased 1.1% in April and the 10-City and 20-City Composites posted gains of 1.0% and 1.1% month-over-month. After seasonal adjustment, the National index was unchanged; the 10- and 20-city composites were up 0.3% and 0.4%. All 20 cities reported increases in April before seasonal adjustment; after seasonal adjustment, 12 were up and eight were down.
Analysis
"Home prices continue to rise across the country, but the pace is not accelerating," says David M. Blitzer, Managing Director and Chairman of the Index Committee at S&P Dow Jones Indices. "Moreover, consumer expectations are consistent with the current pace of price increases. A recent national survey published by the New York Fed showed the average expected price increase among both owners and renters is 4.1%. Both the current rate of home price increases and the consumers' expectations are a bit lower than the long term annual price change of 4.9% since 1975. These figures, however, do not adjust for inflation. The real, or inflation adjusted, price change since 1975 is one percent per year. Given the current inflation rate of under two percent, real home prices today are rising more quickly than is typical. The three out of five consumers in the survey who see home ownership as a good or somewhat good investment may be thinking in real terms.
"Recent housing data is positive. Sales of new and existing homes are rising in recent reports and construction of new homes enjoyed strong gains in May. At the same time, the proportion of new construction that is apartments rather than single family homes remains high. In the past year, 34% of housing starts were apartments, compared to 22% on average since 1975. One aspect of this may be condominiums. Separately, S&P Dow Jones Indices reports the S&P/Case-Shiller Condo Price indices for Los Angeles, San Francisco, Chicago, Boston and New York. In all but LA, condo prices are rising faster than single family homes."
Graphical Representations of the U.S. Housing Market
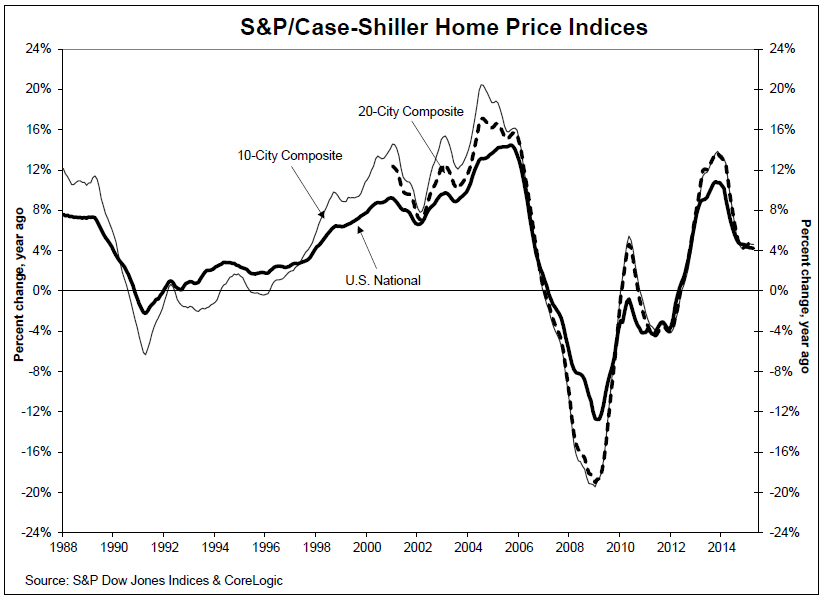
The chart below depicts the annual returns of the U.S. National, the 10-City Composite and the 20-City Composite Home Price Indices. The S&P/Case-Shiller U.S. National Home Price Index, which covers all nine U.S. census divisions, recorded a 4.2% annual gain in April 2015. The 10- and 20-City Composites reported year-over-year increases of 4.6% and 4.9%.
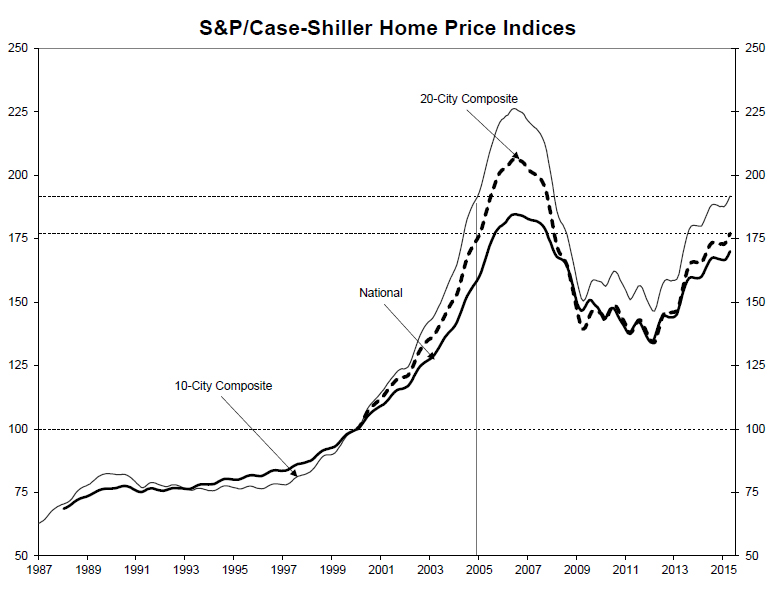
The second chart below shows the index levels for the U.S. National, 10-City and 20-City Composite Indices. As of April 2015, average home prices for the MSAs within the 10-City and 20-City Composites are back to their autumn 2004 levels. Measured from their June/July 2006 peaks, the peak-to-current decline for both Composites is approximately 14-16%. Since the March 2012 lows, the 10-City and 20-City Composites have recovered 31.0% and 32.0%.
Real Estate Listings Showcase


This website uses cookies to improve user experience. By using our website you consent in accordance with our Cookie Policy. Read More