The WPJ
Residential Real Estate News

$3.5 Billion in Home Flipping Loans Made in Q1 for Homes Flipped in U.S.
Reaches 9-year high, with highest Home Flipping Rates in DC, Nevada, Alabama, Tennessee, Maryland
According to ATTOM Data Solutions' Q1 2017 U.S. Home Flipping Report, 43,615 single family homes and condos were flipped -- sold in an arms-length transfer for the second time within a 12-month period -- nationwide in the first quarter of 2017, down 8 percent from the previous quarter and down 6 percent from a year ago to the lowest number of homes flipped since Q1 2015 -- a two-year low.
Home flips in Q1 2017 accounted for 6.7 percent of all single family home and condo sales during the quarter, up from 5.8 percent in the previous quarter and unchanged from a year ago.
For the report, a home flip is defined as a property that is sold in an arms-length sale for the second time within a 12-month period based on publicly recorded sales deed data collected by ATTOM Data Solutions in more than 950 counties accounting for more than 80 percent of the U.S. population (see full methodology below).
One-third (33.3 percent) of all single family homes and condos flipped in Q1 2017 were purchased by the flipper with financing, up from 31.9 percent in Q4 2016 and up from 29.5 percent in Q1 2016 to the highest level since Q3 2008, when 37.6 percent of completed home flips were purchased by the flipper using financing.
"The business of financing for home flippers continued to grow in the first quarter of 2017 even as the home flipping rate plateaued compared to a year ago and average home flipping returns decreased for the second consecutive quarter," said Daren Blomquist, senior vice president at ATTOM Data Solutions. "Home flippers financed an estimated $3.5 billion in purchases for homes flipped during the quarter, up from $3.3 billion in the previous quarter and up from $2.4 billion a year ago to the highest level since the fourth quarter of 2007 -- a more than nine-year high."
Colorado Springs, Denver, Seattle lead markets with most financed home flips
Among 85 metropolitan statistical areas with at least 90 completed home flips in Q1 2017, those with the highest share originally purchased by the flipper with financing were Colorado Springs, Colorado (69.3 percent); Denver, Colorado (54.8 percent); Seattle, Washington (51.6 percent); Boston, Massachusetts (51.3 percent); and Providence, Rhode Island (47.3 percent).
"Seattle has such a high number of flippers who are financing their purchases relative to the U.S. as a whole due to escalating home prices in our region. The decision to finance is proof that these flippers believe the risks of financing are low due to our booming housing market," said Matthew Gardner, chief economist at Windermere Real Estate, covering the Seattle market, where the Q1 2017 home flipping rate of 8.0 percent was above the national average and up 7 percent from a year ago. "While the number of home flippers across the nation is not growing, the opposite is true in Seattle. The demand for homes in our market is extremely competitive and this is enabling flippers to still see a return, even amidst rising home prices."
Other markets where more than 40 percent of home flips completed in Q1 2017 were originally purchased by the flipper using financing included San Diego, California (46.3 percent); Minneapolis-St. Paul, Minnesota (46.2 percent); Phoenix, Arizona (44.1 percent); San Francisco, California (43.0 percent); and Washington, D.C. (40.5 percent).
"With low interest rates, and available lenders willing to provide non-owner occupied loans, we are seeing many of our investors across Southern California take advantage of leverage financing when participating in housing flips," said Michael Mahon, president at First Team Real Estate, covering the Southern California housing market.
Highest home flipping rates in DC, Nevada, Alabama, Tennessee, Maryland and Missouri
The District of Columbia had the highest home flipping rate in the nation in the first quarter (10.7 percent), followed by Nevada (9.8 percent); Alabama (9.0 percent); Tennessee (8.9 percent); Maryland (8.5 percent); and Missouri (8.0 percent).
Among 85 metropolitan statistical areas with at least 90 single family and condo home flips completed in Q1 2017, those with the highest home flipping rate were Memphis, Tennessee (15.1 percent); York-Hanover, Pennsylvania (12.5 percent); Fresno, California (11.1 percent); Birmingham, Alabama (10.3 percent); and Las Vegas, Nevada (10.0 percent).
Average home flipping returns decrease for second consecutive quarter
Homes flipped in the first quarter of 2017 were sold for a median price of $200,000, a gross flipping profit of $64,284 above the median purchase price of $135,716, up from a gross flipping profit of $63,500 in the previous quarter and a gross flipping profit of $59,100 in Q1 2016 -- a new all-time high going back to Q1 2000, as far back as the data is available.
The $64,284 average gross flipping profit translated into an average 47.4 percent gross return on investment (ROI) for homes flipped in Q1 2017, down from an average 49.0 percent average gross flipping ROI in Q4 2016 and an average 48.5 percent average gross flipping ROI in Q1 2016 -- the second straight quarter where the average gross flipping ROI decreased on a year-over-year basis following six consecutive quarters of year-over-year increases.
Highest home flipping returns in Pennsylvania, Ohio, Louisiana, New Jersey, Oklahoma
States with the highest average gross flipping ROI in the first quarter were Pennsylvania (107.1 percent); Ohio (96.3 percent); Louisiana (96.0 percent); New Jersey (87.1 percent); and Oklahoma (85.7 percent).
Among 85 metropolitan statistical areas with at least 90 single family and condos home completed flips in Q1 2017, those with the highest average gross flipping ROI were Pittsburgh, Pennsylvania (141.8 percent); Allentown, Pennsylvania (122.2 percent); Cleveland, Ohio (118.6 percent); Philadelphia, Pennsylvania (111.7 percent); and Baltimore, Maryland (106.0 percent).
Older, smaller homes flipped in first quarter
Nationwide, the median size of homes flipped in Q1 2017 was 1,402 square feet, down from a median 1,409 square feet in the previous quarter and 1,428 square feet a year ago to the smallest median square footage as far back as the data is available, Q1 2000.
The median year built of homes flipped in Q1 2017 was 1978, the same as in the previous quarter but down from a median year built of 1981 for homes flipped in Q1 2016.
"As the average age of the U.S. housing stock continues to increase across most of the country due to economic, environmental, and regulatory restrictions hampering investments in new construction growth, we will continue to see a renewal of interests in housing flips by investors willing to invest in the time, money, and resources necessary to update and modernize housing stock for lucrative profits," noted Mahon of First Team Real Estate in Southern California.
Other high-level findings from the report:
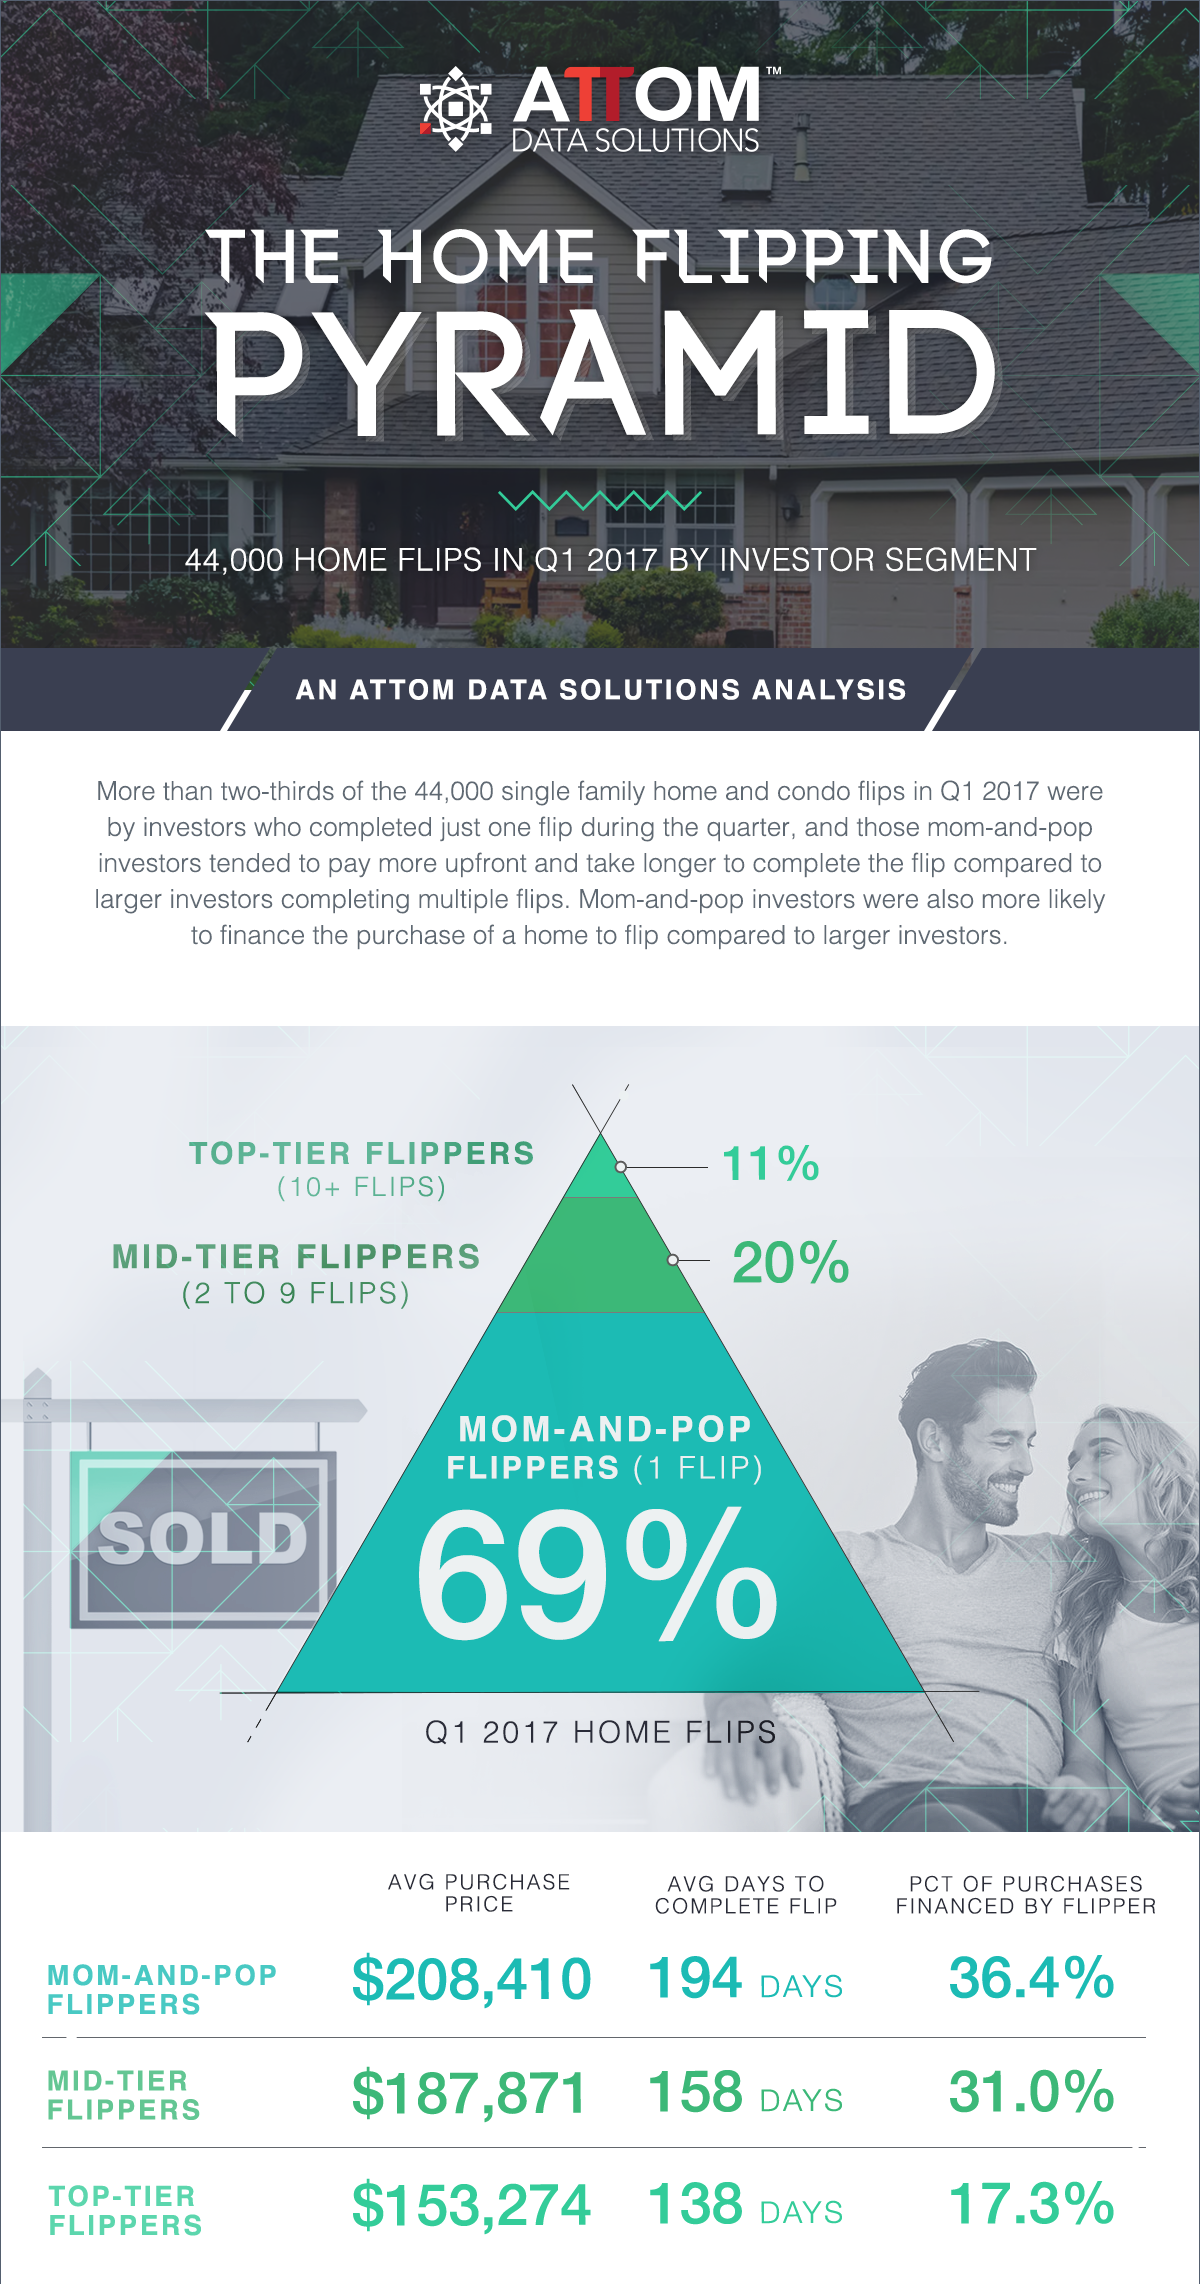
- More than two-thirds (69 percent) of all single family homes and condos flipped in Q1 2017 were by flippers who completed just one flip during the quarter, while 20 percent were by flippers who completed between 2 and 9 flips during the quarter, and 11 percent were by flippers who completed more than 10 flips during the quarter.
- More than one-fourth (26.2 percent) of all completed home flips in Q1 2017 were sold to a cash buyer, indicating another real estate investor, down from 26.3 percent in the previous quarter and down from 27.6 percent in the first quarter of 2016.
- About one-fifth (19.2 percent) of all completed home flips in Q1 2017 were sold to FHA buyers, indicating first time homebuyers, up from 19.1 percent in the previous quarter but down from 19.4 percent in Q1 2016.
Real Estate Listings Showcase


This website uses cookies to improve user experience. By using our website you consent in accordance with our Cookie Policy. Read More