The WPJ
Residential Real Estate News

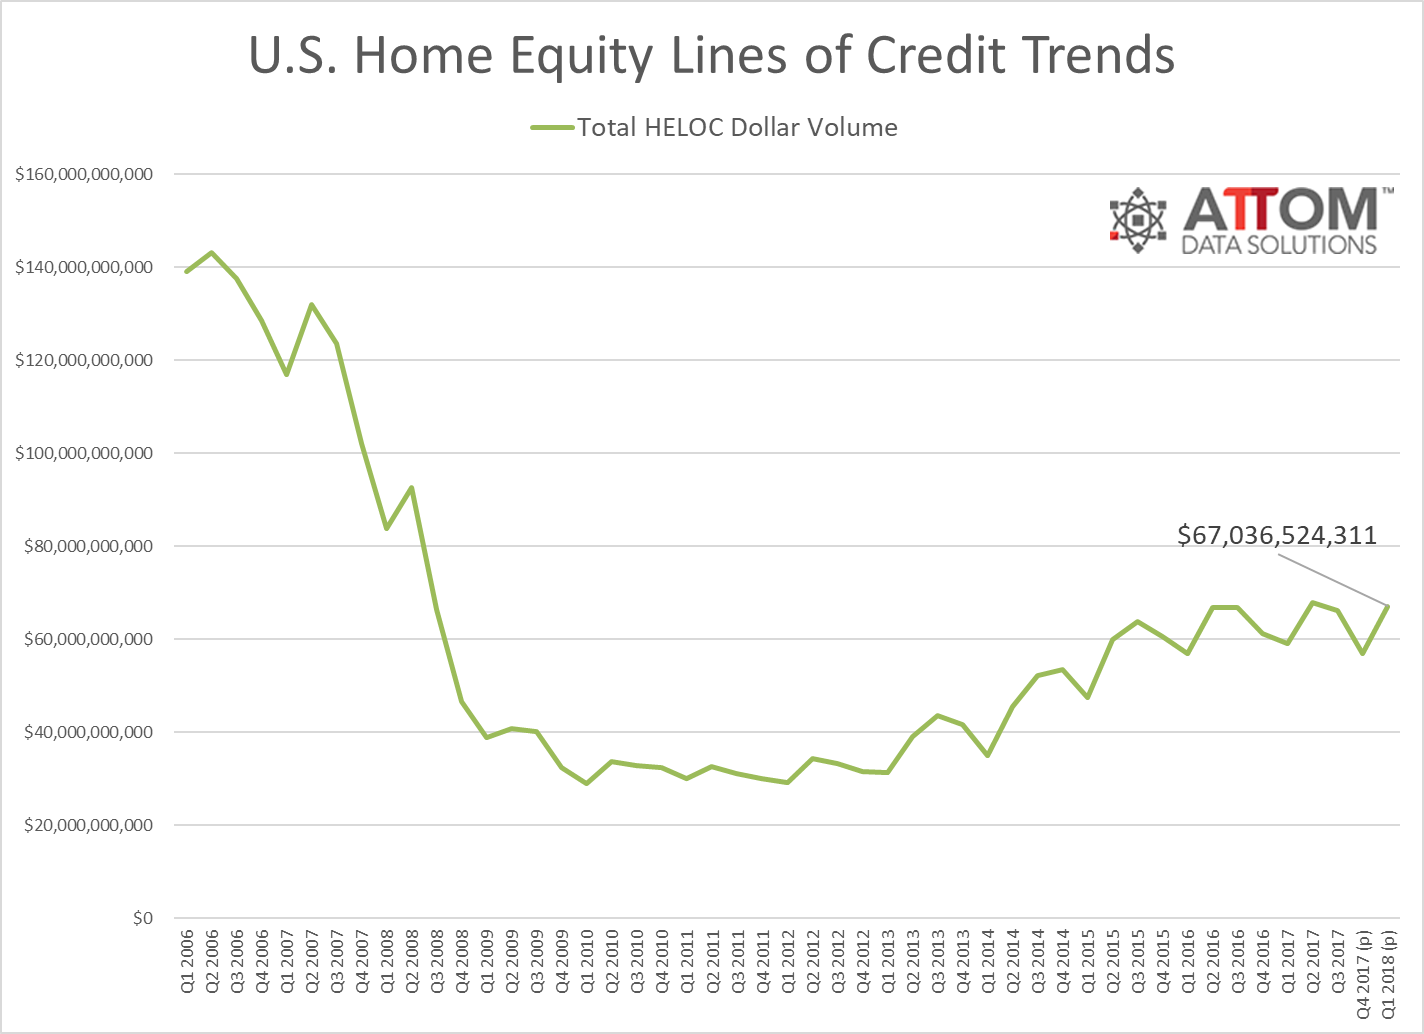
Home Equity Lines of Credit Spike 14 Percent in U.S.
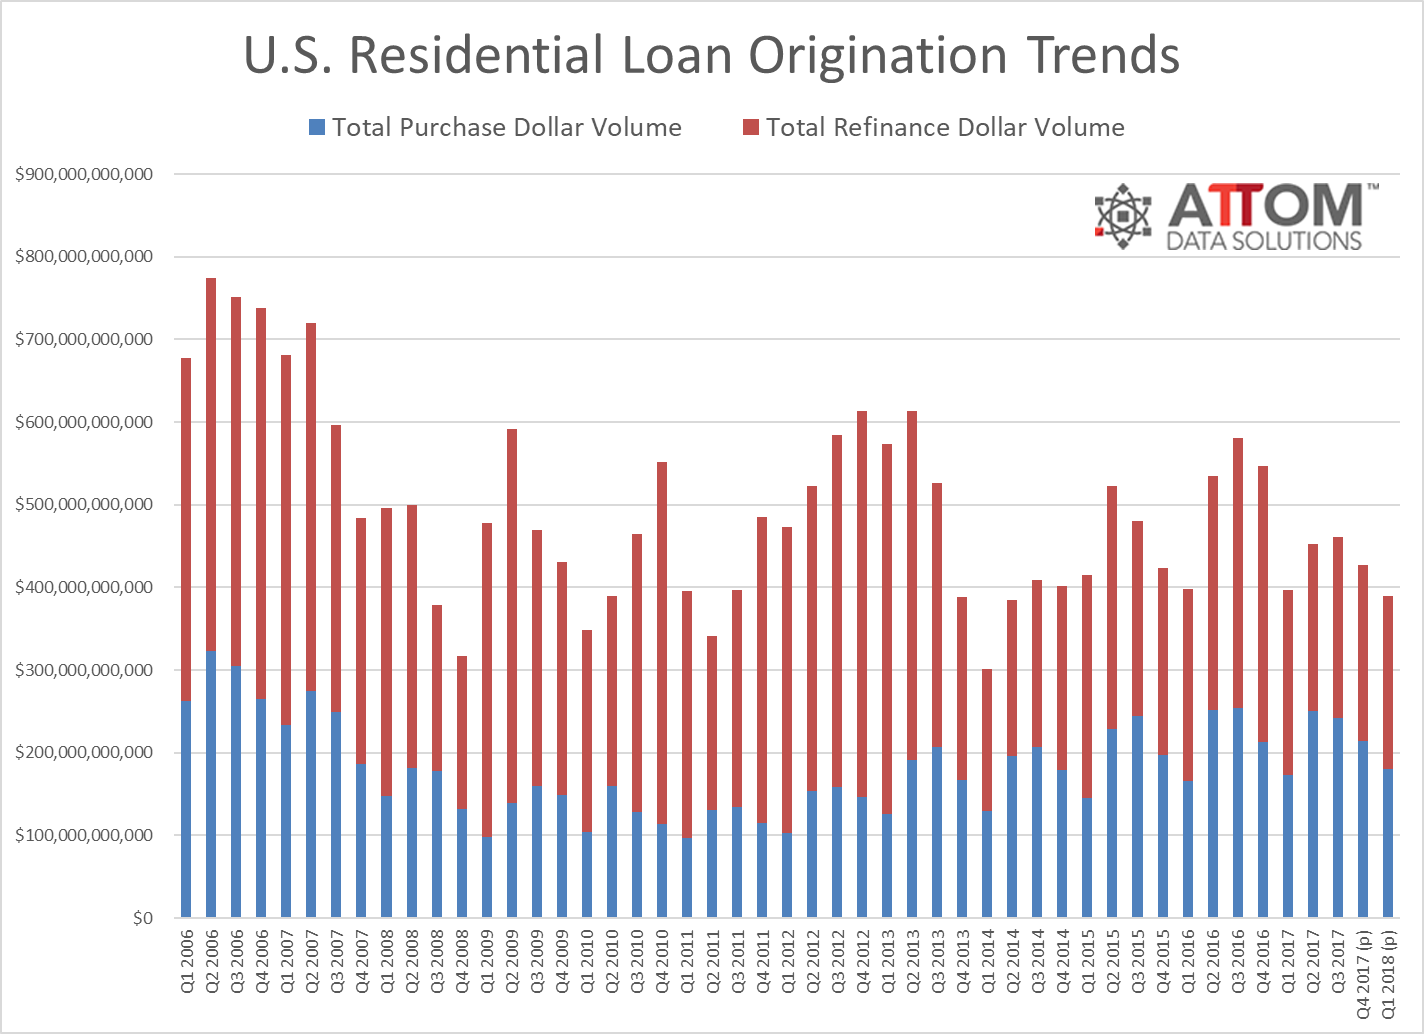
According to ATTOM Data Solution's Q1 2018 U.S. Residential Property Loan Origination Report, more than 1.8 million (1,813,691) loans secured by residential property (1 to 4 units) were originated in Q1 2018, down 5 percent from the previous quarter and down 3 percent from a year ago.
The loan origination report is derived from publicly recorded mortgages and deeds of trust collected by ATTOM Data Solutions in more than 1,700 counties accounting for more than 87 percent of the U.S. population. Counts and dollar volumes for the two most recent quarters are projected based on available data at the time of the report (see full methodology below).
"Putting home equity to work is the name of the game in the 2018 housing market -- both for current homeowners as well as homebuyers," said Daren Blomquist, senior vice president at ATTOM Data Solutions. "With interest rates rising and home price appreciation accelerating, current homeowners are increasingly turning to home equity lines of credit rather than refinances to tap their home's equity. And given that median down payments rose more than four times as fast as median home prices over the past year, it's not surprising that homebuyers are increasingly getting help from co-buyers -- often in exchange for a share of their home's future equity."
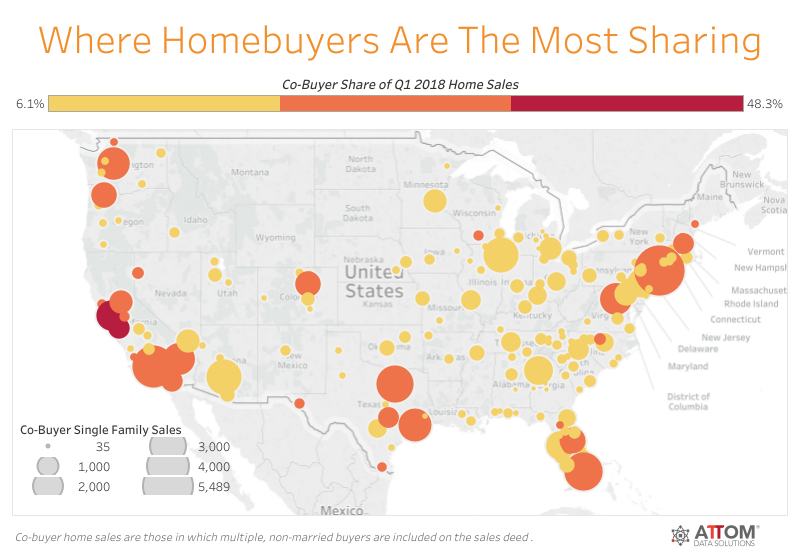
Co-buyers account for 17.4 percent of all Q1 2018 home sales
Nationwide, 17.4 percent of all single family home purchases in Q1 2018 were to co-buyers (multiple, non-married buyers listed on the sales deed), up from 16.3 percent from a year ago and up from 14.9 percent two years ago.
"Homeownership rates are still hovering around historic lows -- even though lenders continue to offer more low down payment options," said Michael Micheletti, director of corporate communications at Unison, a company that provides down payment assistance to homebuyers in exchange for a share of any future increase in the home's value. "Letting people borrow more doesn't make buying a home more accessible or affordable. It's not surprising that in places like Seattle, the Bay Area, and other challenging markets buyers are looking at ways to increase their purchasing power, and reduce the amount of debt they are taking on. The sharing, co-buying and co-owning of a home movement will only grow as more millennials and Gen Z enter the marketplace."
The average down payment for homes purchased by co-buyers nationwide was $56,911, 46 percent higher than the average down payment of $38,915 for homes purchased by other homebuyers. The average co-buyer down payment represented 15.3 percent of the average sales price, 35 percent higher than the 11.4 percent for other homebuyers.
Among 184 metropolitan statistical areas analyzed for co-buyer share, those with the highest percentage of co-buyers were San Jose, California (48.3 percent); San Francisco, California (37.9 percent); Seattle, Washington (27.7 percent); Honolulu, Hawaii (27.7 percent); and Miami, Florida (27.6 percent).
HELOCs up more than 50 percent in Hartford, Nashville, Las Vegas, Raleigh, Indianapolis
Among 165 metropolitan statistical areas analyzed for loan originations, those with the biggest year-over-year increase in HELOC originations in Q1 2018 were Athens, Georgia (up 176 percent); Chattanooga, Tennessee (up 165 percent); Norwich, Connecticut (up 99 percent); Kingsport, Tennessee (up 92 percent); and Atlantic City, New Jersey (up 87 percent).
Among 50 metro areas with a population of at least 1 million, those with the biggest year-over-year increase in HELOC originations in Q1 2018 were Hartford, Connecticut (up 80 percent); Nashville, Tennessee (up 74 percent); Las Vegas, Nevada (up 69 percent); Raleigh, North Carolina (up 56 percent); and Indianapolis, Indiana (up 51 percent).
Median down payment increases 27 percent from year ago
The median down payment on single-family homes and condos purchased with financing in Q1 2018 was $16,750, down 4 percent from $17,500 in the previous quarter but still up 27 percent from $13,207 in Q1 2017.
The median down payment of $16,750 was 6.6 percent of the median sales price of the homes purchased with financing during the quarter, down from 6.9 percent in the previous quarter but still up from 5.5 percent in Q1 2017.
Among 83 metropolitan statistical areas analyzed for median down payments, those with the biggest median down payments for homes purchased in Q1 2018 were San Jose, California ($298,250); San Francisco, California ($180,000); Los Angeles, California ($122,000); Oxnard-Thousand Oaks-Ventura, California ($102,958); and San Diego, California ($80,100).
Other metro areas with median down payments of $50,000 or higher in the first quarter were Naples, Florida ($64,750); Seattle, Washington ($59,800); Boston, Massachusetts ($55,000); and New York-Newark-Jersey City ($50,000).
FHA loan share decreases to more than six-year low
Residential loans backed by the Federal Housing Administration (FHA) accounted for 10.9 percent of all residential property loans originated in Q1 2018, down from 12.0 percent in the previous quarter and down from 13.3 percent a year ago to the lowest share since Q4 2011 -- a more than six-year low.
Residential loans backed by the U.S. Department of Veterans Affairs (VA) accounted for 6.2 percent of all residential property loans originated in Q1 2018, down from 6.6 percent in the previous quarter and down from 6.6 percent a year ago.
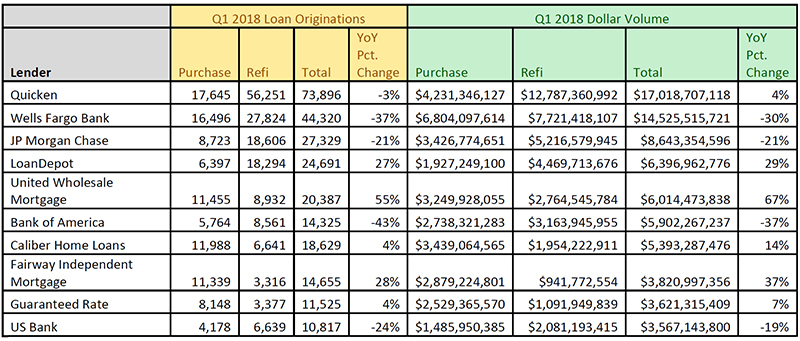
Top loan originators for Q1 2018
The table below shows the top 10 mortgage originators in Q1 2018 based on dollar volume of loans.
- 665,887 of the residential loans originated in Q1 2018 were purchase loans, down 16 percent from the previous quarter but still up 2 percent from a year ago.
- 799,939 of the residential loans originated in Q1 2018 were refinance loans, down 2 percent from the previous quarter and down 11 percent from a year ago.
- 347,875 Home Equity Lines of Credit (HELOCs) were originated on residential properties in Q1 2018, up 18 percent from the previous quarter and up 14 percent from a year ago.
The loan origination report is derived from publicly recorded mortgages and deeds of trust collected by ATTOM Data Solutions in more than 1,700 counties accounting for more than 87 percent of the U.S. population. Counts and dollar volumes for the two most recent quarters are projected based on available data at the time of the report (see full methodology below).
"Putting home equity to work is the name of the game in the 2018 housing market -- both for current homeowners as well as homebuyers," said Daren Blomquist, senior vice president at ATTOM Data Solutions. "With interest rates rising and home price appreciation accelerating, current homeowners are increasingly turning to home equity lines of credit rather than refinances to tap their home's equity. And given that median down payments rose more than four times as fast as median home prices over the past year, it's not surprising that homebuyers are increasingly getting help from co-buyers -- often in exchange for a share of their home's future equity."
Co-buyers account for 17.4 percent of all Q1 2018 home sales
Nationwide, 17.4 percent of all single family home purchases in Q1 2018 were to co-buyers (multiple, non-married buyers listed on the sales deed), up from 16.3 percent from a year ago and up from 14.9 percent two years ago.
"Homeownership rates are still hovering around historic lows -- even though lenders continue to offer more low down payment options," said Michael Micheletti, director of corporate communications at Unison, a company that provides down payment assistance to homebuyers in exchange for a share of any future increase in the home's value. "Letting people borrow more doesn't make buying a home more accessible or affordable. It's not surprising that in places like Seattle, the Bay Area, and other challenging markets buyers are looking at ways to increase their purchasing power, and reduce the amount of debt they are taking on. The sharing, co-buying and co-owning of a home movement will only grow as more millennials and Gen Z enter the marketplace."
The average down payment for homes purchased by co-buyers nationwide was $56,911, 46 percent higher than the average down payment of $38,915 for homes purchased by other homebuyers. The average co-buyer down payment represented 15.3 percent of the average sales price, 35 percent higher than the 11.4 percent for other homebuyers.
Among 184 metropolitan statistical areas analyzed for co-buyer share, those with the highest percentage of co-buyers were San Jose, California (48.3 percent); San Francisco, California (37.9 percent); Seattle, Washington (27.7 percent); Honolulu, Hawaii (27.7 percent); and Miami, Florida (27.6 percent).
HELOCs up more than 50 percent in Hartford, Nashville, Las Vegas, Raleigh, Indianapolis
Among 165 metropolitan statistical areas analyzed for loan originations, those with the biggest year-over-year increase in HELOC originations in Q1 2018 were Athens, Georgia (up 176 percent); Chattanooga, Tennessee (up 165 percent); Norwich, Connecticut (up 99 percent); Kingsport, Tennessee (up 92 percent); and Atlantic City, New Jersey (up 87 percent).
Among 50 metro areas with a population of at least 1 million, those with the biggest year-over-year increase in HELOC originations in Q1 2018 were Hartford, Connecticut (up 80 percent); Nashville, Tennessee (up 74 percent); Las Vegas, Nevada (up 69 percent); Raleigh, North Carolina (up 56 percent); and Indianapolis, Indiana (up 51 percent).
Median down payment increases 27 percent from year ago
The median down payment on single-family homes and condos purchased with financing in Q1 2018 was $16,750, down 4 percent from $17,500 in the previous quarter but still up 27 percent from $13,207 in Q1 2017.
The median down payment of $16,750 was 6.6 percent of the median sales price of the homes purchased with financing during the quarter, down from 6.9 percent in the previous quarter but still up from 5.5 percent in Q1 2017.
Among 83 metropolitan statistical areas analyzed for median down payments, those with the biggest median down payments for homes purchased in Q1 2018 were San Jose, California ($298,250); San Francisco, California ($180,000); Los Angeles, California ($122,000); Oxnard-Thousand Oaks-Ventura, California ($102,958); and San Diego, California ($80,100).
Other metro areas with median down payments of $50,000 or higher in the first quarter were Naples, Florida ($64,750); Seattle, Washington ($59,800); Boston, Massachusetts ($55,000); and New York-Newark-Jersey City ($50,000).
FHA loan share decreases to more than six-year low
Residential loans backed by the Federal Housing Administration (FHA) accounted for 10.9 percent of all residential property loans originated in Q1 2018, down from 12.0 percent in the previous quarter and down from 13.3 percent a year ago to the lowest share since Q4 2011 -- a more than six-year low.
Residential loans backed by the U.S. Department of Veterans Affairs (VA) accounted for 6.2 percent of all residential property loans originated in Q1 2018, down from 6.6 percent in the previous quarter and down from 6.6 percent a year ago.
Top loan originators for Q1 2018
The table below shows the top 10 mortgage originators in Q1 2018 based on dollar volume of loans.
Real Estate Listings Showcase


This website uses cookies to improve user experience. By using our website you consent in accordance with our Cookie Policy. Read More