The WPJ
Residential Real Estate News

Homeowner Equity in U.S. Increased $871 Billion in Q3
According to CoreLogic's Q3 2017 Home Equity Analysis report, U.S. homeowners with mortgages (roughly 63 percent of all homeowners) have collectively seen their equity increase 11.8 percent year over year, representing a gain of $870.6 billion since Q3 2016.
Additionally, homeowners gained an average of $14,888 in home equity between Q3 2016 and Q3 2017. Western states led the increase, while no state experienced a decrease. Washington homeowners gained an average of approximately $40,000 in home equity and California homeowners gained an average of approximately $37,000 in home equity.
Fast FAQs:
- 260,000 Mortgaged Properties Regained Equity Between Q2 2017 and Q3 2017
- The Number of Underwater Homes Decreased Year Over Year by 0.7 Million
- 2.5 Million Residential Properties with a Mortgage Still in Negative Equity
On a quarter-over-quarter basis, from Q2 2017 to Q3 2017, the total number of mortgaged homes in negative equity decreased 9 percent to 2.5 million homes, or 4.9 percent of all mortgaged properties. Year over year, negative equity decreased 22 percent from 3.2 million homes, or 6.3 percent of all mortgaged properties, from Q3 2016 to Q3 2017.
"Homeowner equity increased by almost $871 billion over the last 12 months, the largest increase in more than three years," said Dr. Frank Nothaft, chief economist for CoreLogic. "This increase is primarily a reflection of rising home prices, which drives up home values, leading to an increase in home equity positions and supporting consumer spending."
Negative equity, often referred to as being "underwater" or "upside down," applies to borrowers who owe more on their mortgages than their homes are worth. Negative equity can occur because of a decline in a home's value, an increase in mortgage debt or both.
Negative equity peaked at 26 percent of mortgaged residential properties in Q4 2009 based on CoreLogic equity data analysis, which began in Q3 2009.
The national aggregate value of negative equity was approximately $275.7 billion at the end of Q3 2017. This is down quarter over quarter by approximately $9.1 billion, or 3.2 percent, from $284.8 billion in Q2 2017 and down year over year by approximately $9.5 billion, or 3.3 percent, from $285.2 billion in Q3 2016.
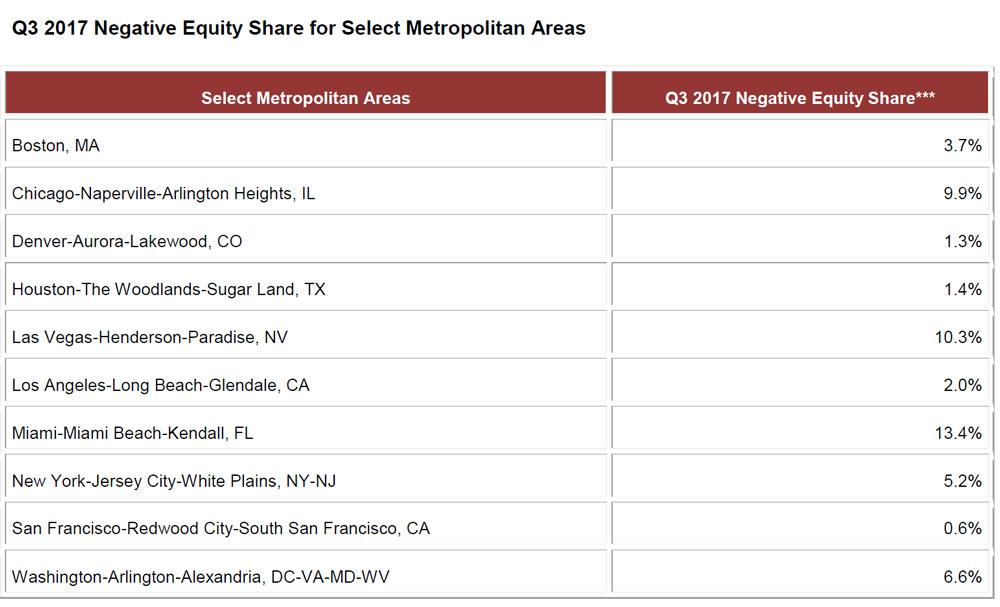
"While homeowner equity is rising nationally, there are wide disparities by geography," said Frank Martell, president and CEO of CoreLogic. "Hot markets like San Francisco, Seattle and Denver boast very high levels of increased home equity. However, some markets are lagging behind due to weaker economies or lingering effects from the great recession. These include large markets such as Miami, Las Vegas and Chicago, but also many small- and medium-sized markets such as Scranton, Pa. and Akron, Ohio."
Real Estate Listings Showcase


This website uses cookies to improve user experience. By using our website you consent in accordance with our Cookie Policy. Read More