The WPJ
Residential Real Estate News

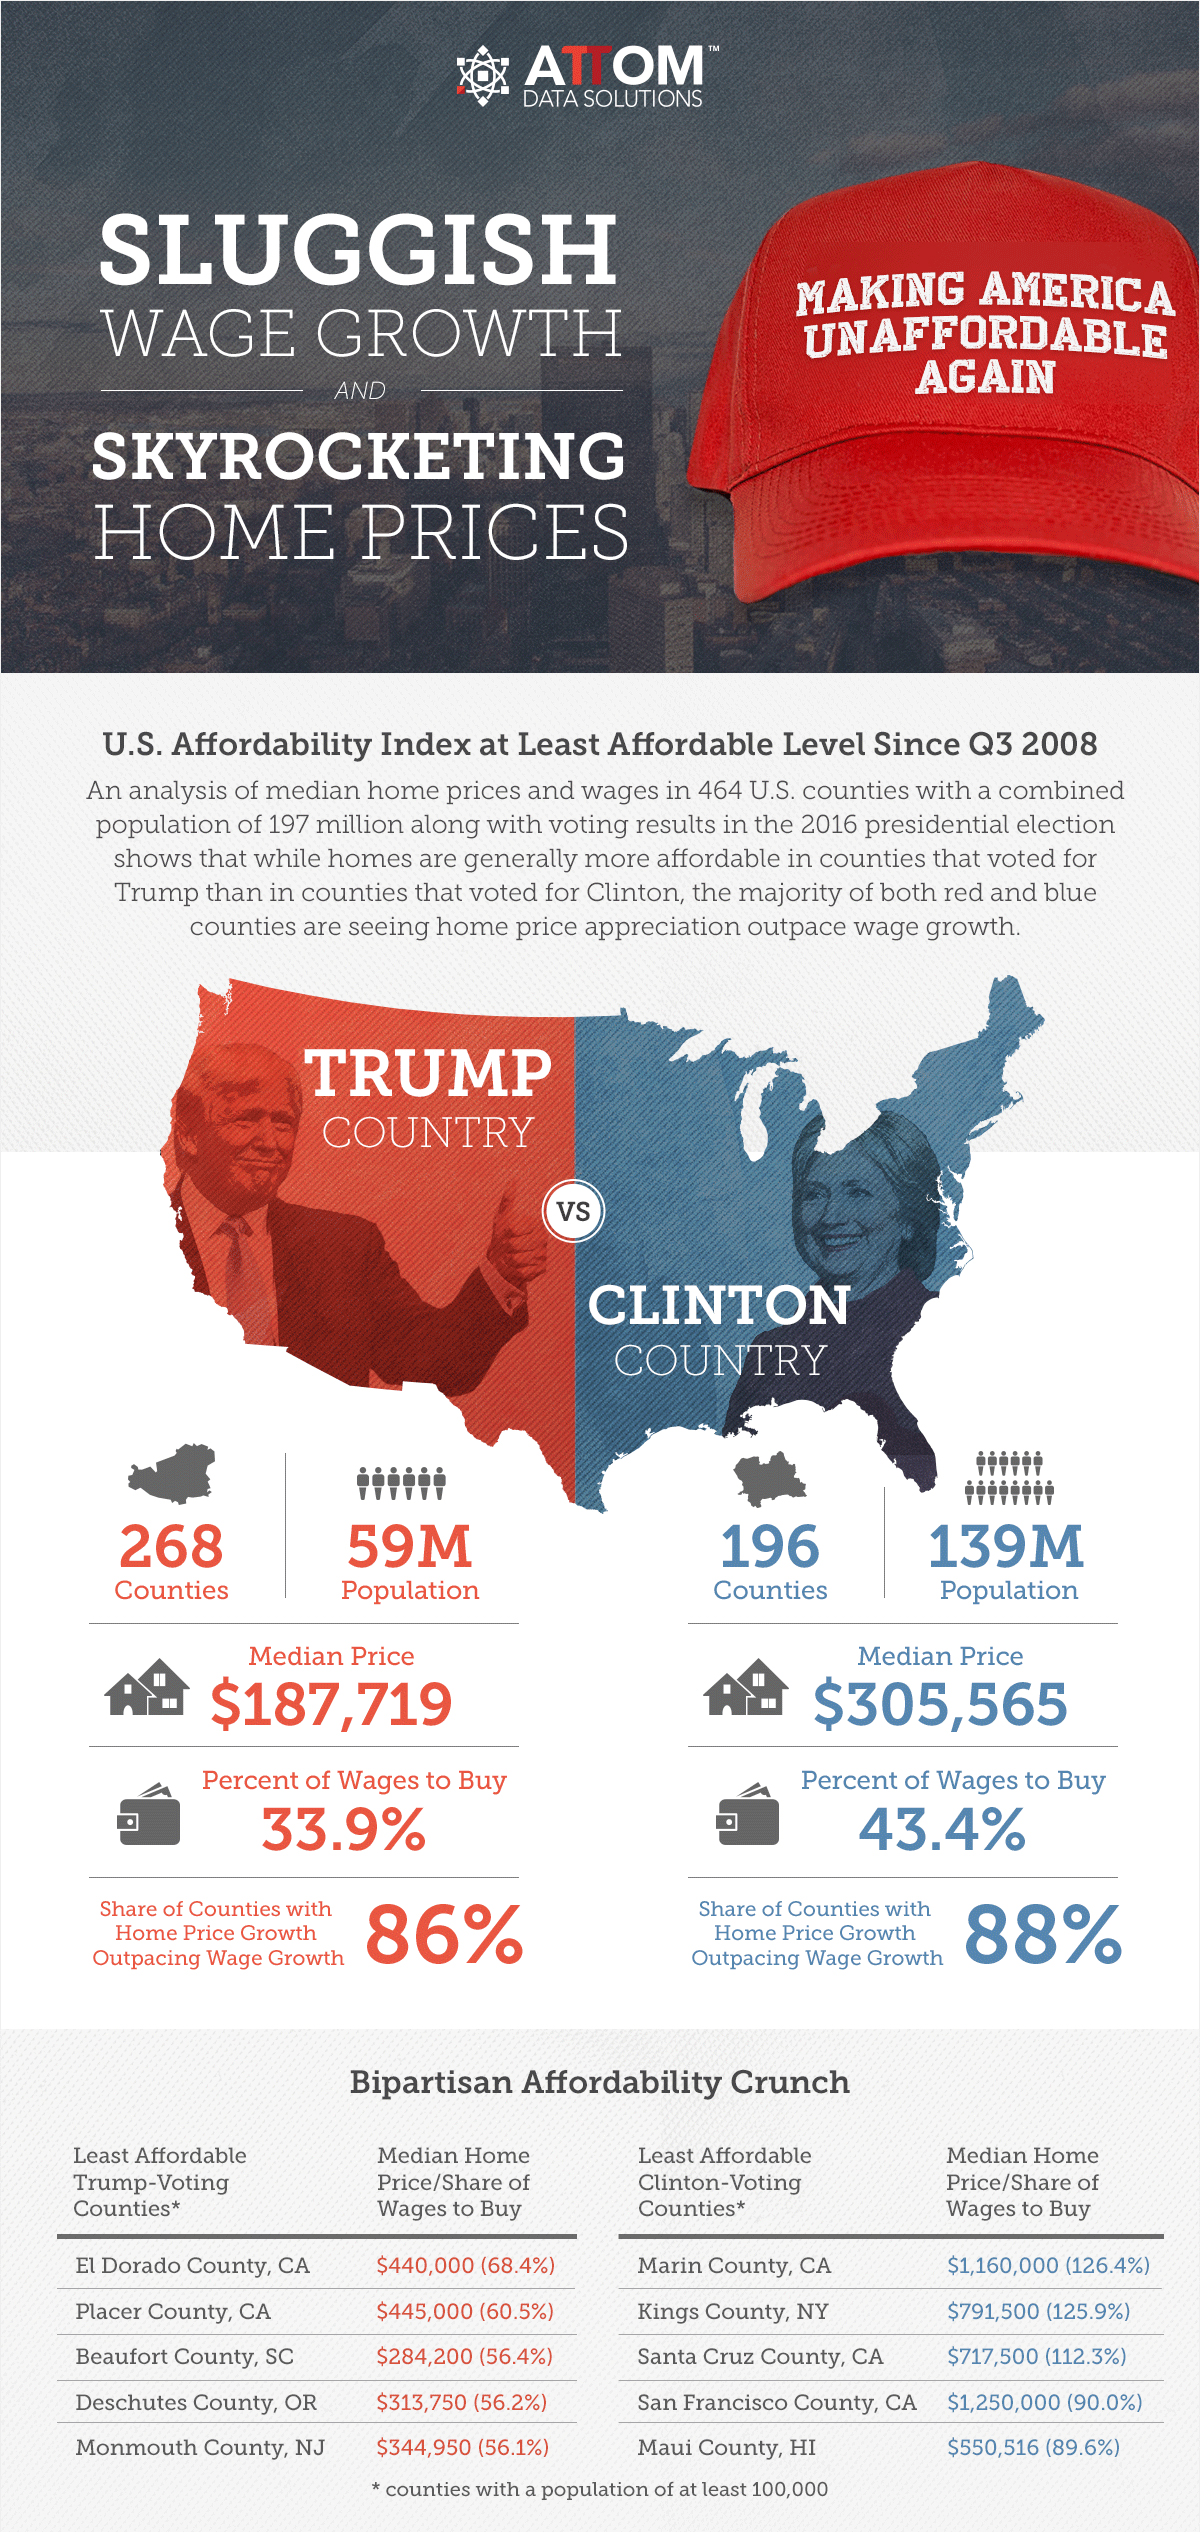
Median Home Prices in U.S. Now Least Affordable Since 2008
Median Home Prices Rose Faster Than Wages in 87 Percent of Local Markets
Based on ATTOM Data Solutions' latest Q2 2017 U.S. Home Affordability Index, the U.S. median home price of $253,000 in the second quarter of 2017 was at the least affordable level since Q3 2008, a nearly nine-year low in affordability.
The national home affordability index was 100 in the second quarter of 2017, the lowest national affordability index since Q3 2008, when the index was 86, and meaning the share of average wages needed to buy a median-priced home nationwide was on par with its historic average (see full methodology below).
The report also shows that 210 of 464 U.S. counties analyzed for the index (45 percent) were less affordable than their historic affordability norms in the second quarter of 2017 -- the highest share of markets less affordable than their historic norms since Q4 2009.
"While home price appreciation in the second quarter accelerated to the fastest pace in more than three years, wage growth turned negative, posting the biggest year-over-year decrease in five years in Q4 2016 -- the most recent average weekly wage data available," said Daren Blomquist, senior vice president at ATTOM Data Solutions. "That combination of accelerating home price growth and slowing wage growth, along with mortgage interest rates that are up nearly 50 basis points from a year ago, eroded home affordability nationwide to the lowest level in nearly nine years, and pushed the highest share of markets beyond the threshold of normal affordability in nearly eight years."
Home prices rise faster than weekly wages in 87 percent of markets
Nationwide the median home sales price in the second quarter of 2017 was $253,000, up 7.7 percent from a year ago -- the biggest annual increase since the Q1 2014. The average weekly wage nationwide was $1,067 in Q4 2016 (the most recent weekly wage data available from the Bureau of Labor Statistics) down 1.4 percent from a year ago -- the biggest annual decrease since Q4 2011.
Since bottoming out nationwide in Q1 2012, median home prices nationwide have increased 69 percent while average weekly wages have increased 9 percent during the same time period.
Median home prices in Q2 2017 grew at a faster annual pace than average weekly wages in 403 of the 464 counties analyzed in the report (87 percent), including Los Angeles County, California; Cook County, Illinois in the Chicago metro area; Maricopa County, Arizona in the Phoenix metro area; San Diego County, California; and Orange County, California.
"All counties within in the Seattle market area saw a sharp contraction in affordability between Q1 and Q2, which is disturbing," said Matthew Gardner, chief economist at Windermere Real Estate, covering the Seattle market, where home price appreciation outpaced wage growth in all three area counties. "The local economy is firing on all cylinders but the number of homes for sale remains at almost historic low levels and this is putting intense upward pressure on home prices as demand far exceeds supply.
Median home prices in King County, where the city of Seattle is located, increased 15 percent from a year ago while average weekly wages increased 3 percent annually.
"Unfortunately, I do not expect see any substantial growth in the number of homes going on the market through the balance of 2017 and this will continue to erode affordability as buyers compete for the few homes that are available to them," Gardner added.
Denver accounts for three of five counties with lowest affordability index in Q2 2017
Counties with the lowest affordability index (least affordable relative to historic norms for the county) in Q2 2017 were Denver County, Colorado (74); Genesee County, Michigan in the Flint metro area (75); Adams County, Colorado in the Denver metro area (77); Arapahoe County, Colorado in the Denver metro area (78); and Weld County, Colorado in the Greeley metro area (78)
Other metro areas with counties ranking in the top 20 for lowest affordability index in Q2 2017 were Knoxville, Tennessee; Boulder, Colorado; Dallas, Texas; Saginaw, Michigan; Nashville, Tennessee; Austin, Texas; Portland, Oregon; Kennewick-Richland, Washington; Lawrenceburg, Tennessee; New York, New York; and Atlanta, Georgia.
Counties with the highest affordability index (most affordable relative to historic norms for the county) in Q2 2017 were Atlantic County, New Jersey, in the Atlantic City metro area (161); Sussex County, New Jersey (153); Onslow County, North Carolina, in the Jacksonville metro area (147); Orange County, New York, in the New York metro area (141); and Tolland County, Connecticut, in the Hartford metro area (138).
Buying a home requires highest share of wages in Bay Area, Brooklyn, Park City, Key West
Nationwide in Q2 2017, buying a median-priced home required 31.8 percent of average wages.
Counties with the highest share of average wages needed to buy a median-priced home in Q2 2017 were Marin County, California, in the San Francisco metro area (126.4 percent); Kings County (Brooklyn), New York (125.9 percent); Santa Cruz County, California (112.3 percent); Summit County, Utah in the Summit Park metro area (107.8 percent); and Monroe County, Florida, in the Key West metro area (100.3 percent).
More than 43 percent of average wages needed to buy a home in 31 percent of markets
Average wage earners would need to spend more than 43 percent of their income -- the maximum debt-to-income ratio allowed for a "qualified mortgage" under guidelines from the Consumer Financial Protection Bureau (CFPB) -- to buy a median-priced home in 144 of the 464 counties (31 percent) analyzed for the report.
Counties requiring more than 43 percent of income to buy a median-priced home included Los Angeles County, California (66.9 percent); San Diego County, California (65.2 percent); Orange County, California (83.2 percent); Kings County (Brooklyn), New York (125.9 percent); and Queens County, New York (77.6 percent).
Less than 25 percent of average wages needed to a buy a home in 22 percent of markets
Average wage earners would need to spend less than 25 percent of their income to buy a median-priced home in 102 of the 464 counties (22 percent) analyzed for the report, including Wayne County, Michigan in the Detroit metro area (12.8 percent); Philadelphia County, Pennsylvania (17.1 percent); Cuyahoga County, Ohio in the Cleveland metro area (18.4 percent); Allegheny County, Pennsylvania in the Pittsburgh metro area (22.1 percent); and Saint Louis County, Missouri (24.9 percent).
"Ohio continues to be a very affordable housing market, even though we are seeing an overall statewide increase in housing prices," said Matthew Watercutter, senior regional vice president and broker of record for HER Realtors, covering the Dayton, Columbus and Cincinnati markets in Ohio. "This increase is due to a lack of quality inventory, which causes multiple offers on homes and above asking offers in order for buyers to achieve an accepted offer very early in the marketing of new inventory.
"Some areas are still seeing lower than normal sale prices and home prices are still recovering," Watercutter added. "These areas are still in an economic recovery mode, and have not seen the increase in housing prices as quickly as other areas of the state."
Real Estate Listings Showcase


This website uses cookies to improve user experience. By using our website you consent in accordance with our Cookie Policy. Read More