The WPJ
Residential Real Estate News

Miami Bucks National Trend as U.S. Home Prices Decelerate
The Miami real estate market is now the only US city posting double-digit price gains, as home price appreciation nationwide continued to slow this fall.
According to the latest the S&P/Case-Shiller Home Price Indices, U.S. home prices continue to decelerate in September 2014. The 10-City Composite gained 4.8% year-over-year, down from 5.5% in August. The 20-City Composite gained 4.9% year-over-year, compared to 5.6% in August.
See related story: Miami Enjoys Record-Breaking Home Sales in October.
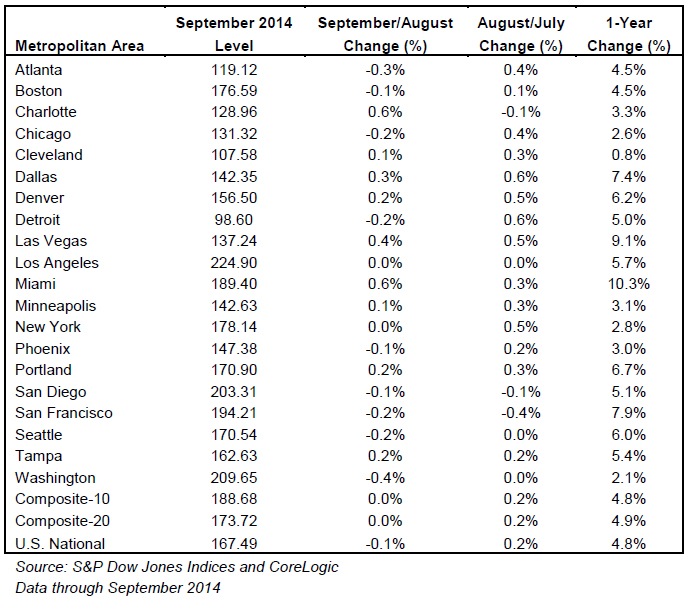
The National and Composite Indices were both slightly negative in September. Both the 10 and 20-City Composites reported a slight downturn while the National Index posted a -0.1% change for the month. Charlotte and Miami led all cities in September with increases of 0.6%. Atlanta and Washington D.C. offset those gains by reporting decreases of 0.3% and 0.4%.
The chart above depicts the annual returns of the U.S. National, the 10-City Composite and the 20-City Composite Home Price Indices. The S&P/Case-Shiller U.S. National Home Price Index, which covers all nine U.S. census divisions, recorded a 4.8% annual gain in September 2014. The 10- and 20-City Composites reported year-over-year increases of 4.8% and 4.9%.
"The overall trend in home price increases continues to slow down," says David M. Blitzer, Managing Director and Chairman of the Index Committee at S&P Dow Jones Indices. "The National Index reported a month-over-month decrease for the first time since November 2013. The Northeast region reported its first negative monthly returns since December 2013 and its worst annual returns since December 2012 due to weaknesses in Washington D.C. and Boston. The West and Southwest, previously strong regions, are seeing price gains fade. The only region showing any sustained strength is the Southeast led by Florida; price gains are also evident in Atlanta and Charlotte.
"The 10- and 20-City Composites continued their year-over-year downward trend, gaining 4.8% and 4.9% compared to last month's year-over-year gains of 5.6%. Las Vegas, which has shown double digit annual gains, posted an annual return of 9.1%, its first time below 10% since October 2012.
Miami, however, continues to impress with another double digit annual gain of 10.3%. It is the only city that currently has a year-over-year double digit gain. Charlotte was the only city in September to show an annual increase relative to last month. Eighteen of the 20 cities reported slower annual gains compared to last month.
"Other housing statistics paint a mixed to slightly positive picture. Housing starts held above one million at annual rates on gains in single family homes, sales of existing homes are gaining, builders' sentiment is improving, foreclosures continue to be worked off and mortgage default rates are at pre-crisis levels. With the economy looking better than a year ago, the housing outlook for 2015 is stable to slightly better."
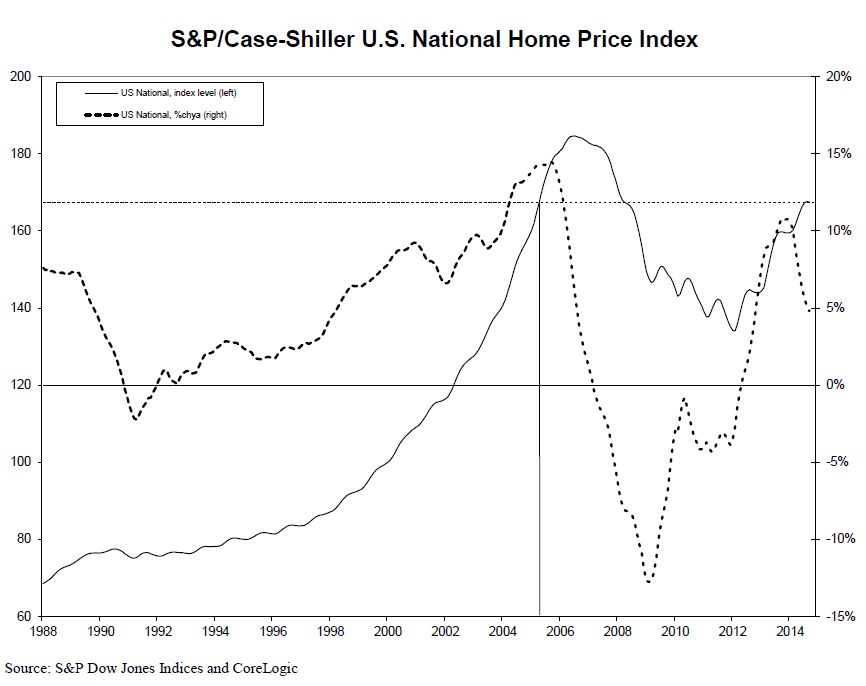
The chart above shows the index levels for the U.S. National Home Price Index, as well as its annual returns. As of September 2014, average home prices across the United States are back to their levels posted in the spring of 2005. The National Index was down 0.1% in September 2014 and 4.8% above September 2013.
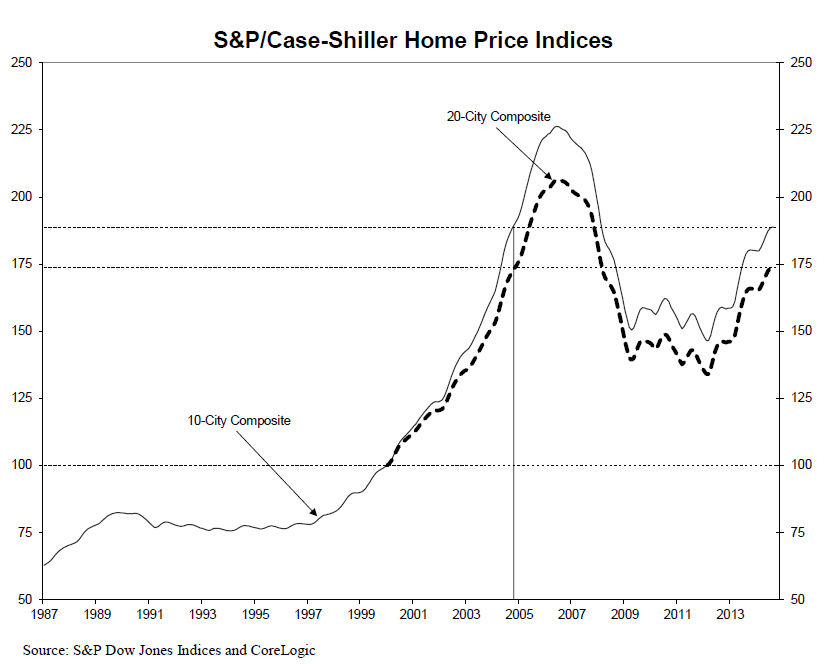
The chart above shows the index levels for the 10-City and 20-City Composite Indices. As of September 2014, average home prices for the MSAs within the 10-City and 20-City Composites are back to their autumn 2004 levels. Measured from their June/July 2006 peaks, the peak-to-current decline for both Composites is approximately 15-17%. The recovery from the March 2012 lows is 28.8% and 29.6% for the 10-City and 20-City Composites.
Charlotte and Dallas were the only two cities to see their annual gains increase while Cleveland remained virtually unchanged for the fourth consecutive month. All other cities saw their annual gains decelerate. Miami continued to lead all cities with a 10.3% year-over-year gain. Detroit saw its gains drop to 5.0% from 6.7% the previous month.
September recorded mixed monthly figures. Nine cities recorded lower monthly figures while nine posted increases. Los Angeles and New York both reported flat monthly changes. Washington D.C. had the largest decrease of all 20 cities at 0.4% month-over-month.
The table below summarizes the results for September 2014. The S&P/Case-Shiller Home Price Indices are revised for the 24 prior months, based on the receipt of additional source data.
Real Estate Listings Showcase


This website uses cookies to improve user experience. By using our website you consent in accordance with our Cookie Policy. Read More