The WPJ
Residential Real Estate News

U.S. Home Sales Slip in February
According to the National Association of Realtors, after starting the year at the fastest pace in almost a decade, existing-home sales slid in February 2017, but remained above year ago levels both nationally and in all major regions.
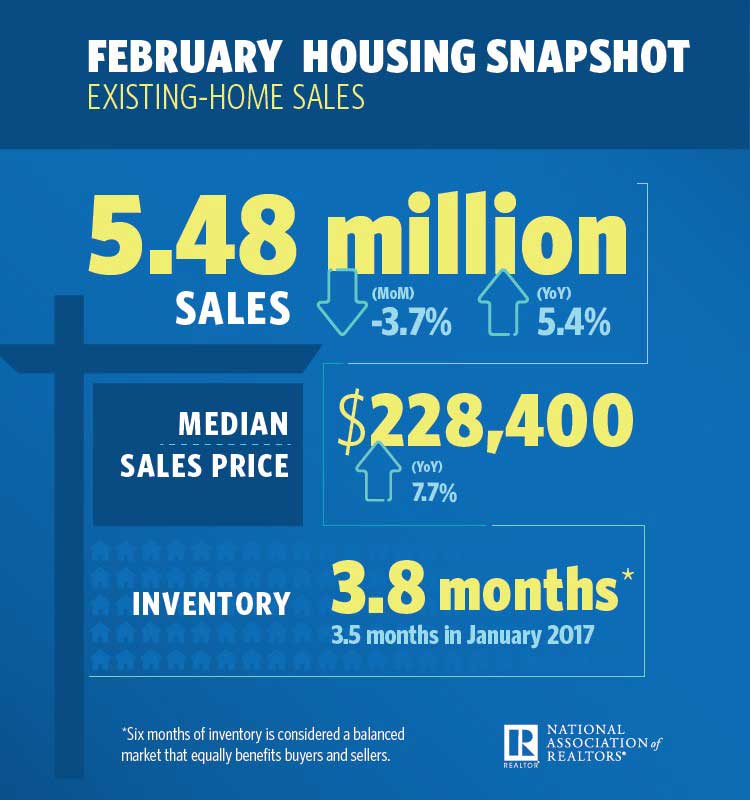
Total U.S. existing-home sales, which are completed transactions that include single-family homes, townhomes, condominiums and co-ops, retreated 3.7 percent to a seasonally adjusted annual rate of 5.48 million in February from 5.69 million in January. Despite last month's decline, February's sales pace is still 5.4 percent above a year ago.
Lawrence Yun, NAR chief economist, says closings retreated in February as too few properties for sale and weakening affordability conditions stifled buyers in most of the country. "Realtors are reporting stronger foot traffic from a year ago, but low supply in the affordable price range continues to be the pest that's pushing up price growth and pressuring the budgets of prospective buyers," he said. "Newly listed properties are being snatched up quickly so far this year and leaving behind minimal choices for buyers trying to reach the market."
Added Yun, "A growing share of homeowners in NAR's first quarter HOME survey said now is a good time to sell, but until an increase in listings actually occurs, home prices will continue to move hastily."
The median existing-home price for all housing types in February was $228,400, up 7.7 percent from February 2016 ($212,100). February's price increase was the fastest since last January (8.1 percent) and marks the 60th consecutive month of year-over-year gains.
Total housing inventory at the end of February increased 4.2 percent to 1.75 million existing homes available for sale, but is still 6.4 percent lower than a year ago (1.87 million) and has fallen year-over-year for 21 straight months. Unsold inventory is at a 3.8-month supply at the current sales pace (3.5 months in January).
All-cash sales were 27 percent of transactions in February (matching the highest since November 2015), up from 23 percent in January and 25 percent a year ago. Individual investors, who account for many cash sales, purchased 17 percent of homes in February, up from 15 percent in January but down from 18 percent a year ago. Seventy-one percent of investors paid in cash in February (matching highest since April 2015).
First-time buyers were 32 percent of sales in February, which is down from 33 percent in January but up from 30 percent a year ago. NAR's 2016 Profile of Home Buyers and Sellers - released in late 2016 - revealed that the annual share of first-time buyers was 35 percent.
"The affordability constraints holding back renters from buying is a signal to many investors that rental demand will remain solid for the foreseeable future," said Yun. "Investors are still making up an above average share of the market right now despite steadily rising home prices and few distressed properties on the market, and their financial wherewithal to pay in cash gives them a leg-up on the competition against first-time buyers."
According to Freddie Mac, the average commitment rate for a 30-year, conventional, fixed-rate mortgage inched up in February to 4.17 percent from 4.15 percent in January. The average commitment rate for all of 2016 was 3.65 percent.
Properties typically stayed on the market for 45 days in February, down from 50 days in January and considerably more than a year ago (59 days). Short sales were on the market the longest at a median of 214 days in February, while foreclosures sold in 49 days and non-distressed homes took 45 days. Forty-two percent of homes sold in February were on the market for less than a month.
Inventory data from realtor.com reveals that the metropolitan statistical areas where listings stayed on the market the shortest amount of time in February were San Jose-Sunnyvale-Santa Clara, Calif., 23 days; San Francisco-Oakland-Hayward, Calif., 27 days; Vallejo-Fairfield, Calif., 33 days; Seattle-Tacoma-Bellevue, Wash., 36 days; and Boulder, Colo., at 37 days.
Distressed sales - foreclosures and short sales - were 7 percent of sales for the third straight month in February, and are down from 10 percent a year ago. Six percent of February sales were foreclosures and 1 percent were short sales. Foreclosures sold for an average discount of 18 percent below market value in February (14 percent in January), while short sales were discounted 17 percent (10 percent in January).
Single-family and Condo/Co-op Sales
Single-family home sales declined 3.0 percent to a seasonally adjusted annual rate of 4.89 million in February from 5.04 million in January, and are now 5.8 percent above the 4.62 million pace a year ago. The median existing single-family home price was $229,900 in February, up 7.6 percent from February 2016.
Existing condominium and co-op sales descended 9.2 percent to a seasonally adjusted annual rate of 590,000 units in February, but are still 1.7 percent higher than a year ago. The median existing condo price was $216,100 in February, which is 8.2 percent above a year ago.
Regional Breakdown
February existing-home sales in the Northeast slumped 13.8 percent to an annual rate of 690,000, but are still 1.5 percent above a year ago. The median price in the Northeast was $250,200, which is 4.1 percent above February 2016.
In the Midwest, existing-home sales fell 7.0 percent to an annual rate of 1.20 million in February, but are still 2.6 percent above a year ago. The median price in the Midwest was $171,700, up 6.1 percent from a year ago.
Existing-home sales in the South in January rose 1.3 percent to an annual rate of 2.34 million, and are now 5.9 percent above February 2016. The median price in the South was $205,300, up 9.6 percent from a year ago.
Existing-home sales in the West decreased 3.1 percent to an annual rate of 1.25 million in February, but are 9.6 percent above a year ago. The median price in the West was $339,900, up 9.6 percent from February 2016.
Real Estate Listings Showcase


This website uses cookies to improve user experience. By using our website you consent in accordance with our Cookie Policy. Read More