The WPJ
Residential Real Estate News

Shadow Inventory in U.S. Continues to Decline in July, Supply Falls to 1.6 Million Units
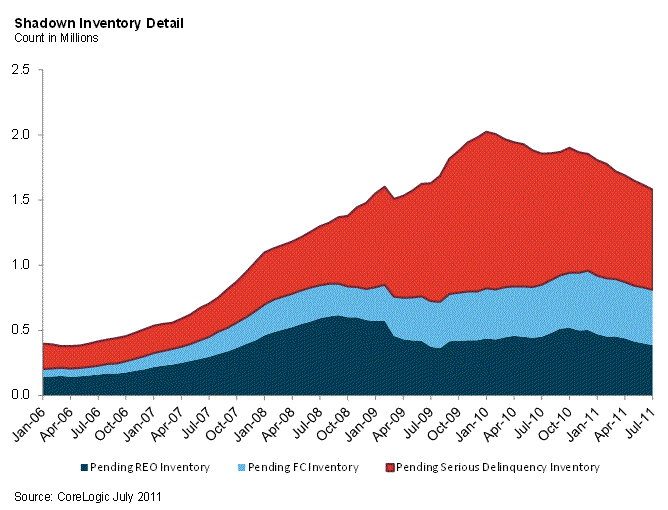
 According to CoreLogic (NYSE: CLGX) latest report, the current U.S. residential shadow inventory as of July 2011 declined slightly to 1.6 million units, representing a supply of 5 months.
This is down from 1.9 million units, a supply of 6 months, from a year ago, and follows a decline from April 2011 when shadow inventory stood at 1.7 million units. The moderate decline in shadow inventory is being driven by a pace of new delinquencies that is slower than the disposition pace of distressed assets.
CoreLogic estimates the current stock of properties in the shadow inventory, also known as pending supply, by calculating the number of distressed properties not currently listed on multiple listing services (MLSs) that are seriously delinquent (90 days or more), in foreclosure and real estate owned (REO) by lenders.
Transition rates of "delinquency to foreclosure" and "foreclosure to REO" are used to identify the currently distressed non-listed properties most likely to become REO properties. Properties that are not yet delinquent but may become delinquent in the future are not included in the estimate of the current shadow inventory. Shadow inventory is typically not included in the official metrics of unsold inventory.
Report Highlights:
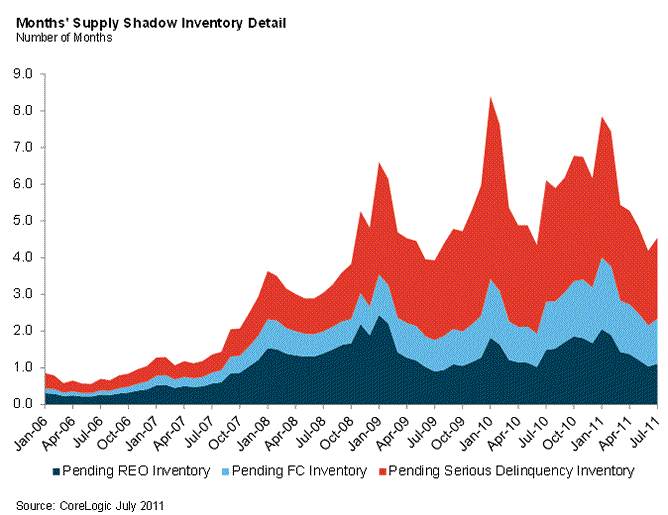
- Shadow inventory of residential properties as of July 2011 fell to 1.6 million units, or 5-months' worth of supply, down from 1.9 million units, or a 6-months' supply, as compared to July 2010.
- Of the 1.6 million properties currently in the shadow inventory, 770,000 units are seriously delinquent (2.2-months' supply), 430,000 are in some stage of foreclosure (1.2-months' supply) and 390,000 are already in REO (1.1-months' supply).
- As of July 2011 the shadow inventory is 22 percent lower than the peak in January 2010 at 2 million units, 8.4-months' supply.
- The total shadow and visible inventory was 5.4 million units in July 2011, down from 6.1 million units a year ago. The shadow inventory accounts for 29 percent of the combined shadow and visible inventories.
- The aggregate current mortgage debt outstanding of the shadow inventory was $336 billion in July 2011, down 18 percent from $411 billion a year ago.
Mark Fleming, chief economist for CoreLogic, commented, "The steady improvement in the shadow inventory is a positive development for the housing market. However, continued price declines, high levels of negative equity and a sluggish labor market will keep the shadow supply elevated for an extended period of time."
Real Estate Listings Showcase


This website uses cookies to improve user experience. By using our website you consent in accordance with our Cookie Policy. Read More