The WPJ
Residential Real Estate News

Case-Schiller Reports U.S. Home Prices Uptick Nationally in 2Q, But Still Below Last Year
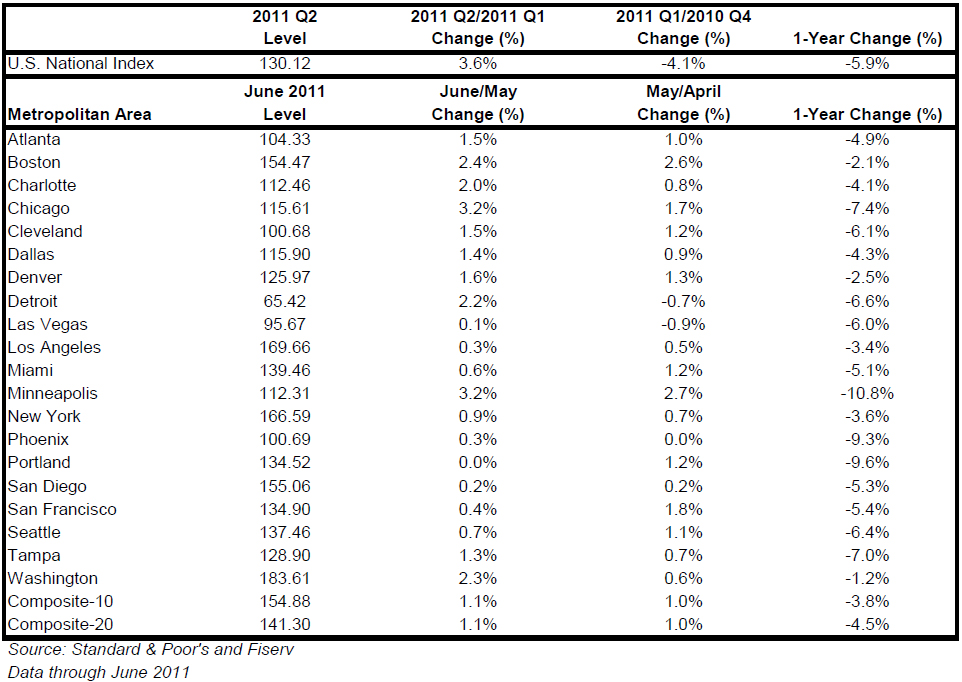
According to S&P Indices for its S&P/Case-Shiller Home Price Indices, U.S. National Home Price Index increased by 3.6% in the second quarter of 2011, after having fallen 4.1% in the first quarter of 2011.
With the second quarter's data, the National Index recovered from its first quarter low, but still posted an annual decline of 5.9% versus the second quarter of 2010. Nationally, home prices are back to their early 2003 levels.
As of June 2011, 19 of the 20 MSAs covered by S&P/Case-Shiller Home Price Indices and both monthly composites were up versus May - Portland was flat. However, they were all down compared to June 2010. Twelve of the 20 MSAs and both Composites have now increased for three consecutive months, a sign of the seasonal strength in the housing market. None of the markets posted new lows with June's report. Minneapolis posted a double-digit 10.8% annual decline; Portland is not far behind at -9.6%.
Thirteen of the cities and both composites saw improvements in their annual rates; however; they all are in negative territory and have been so for three consecutive months.
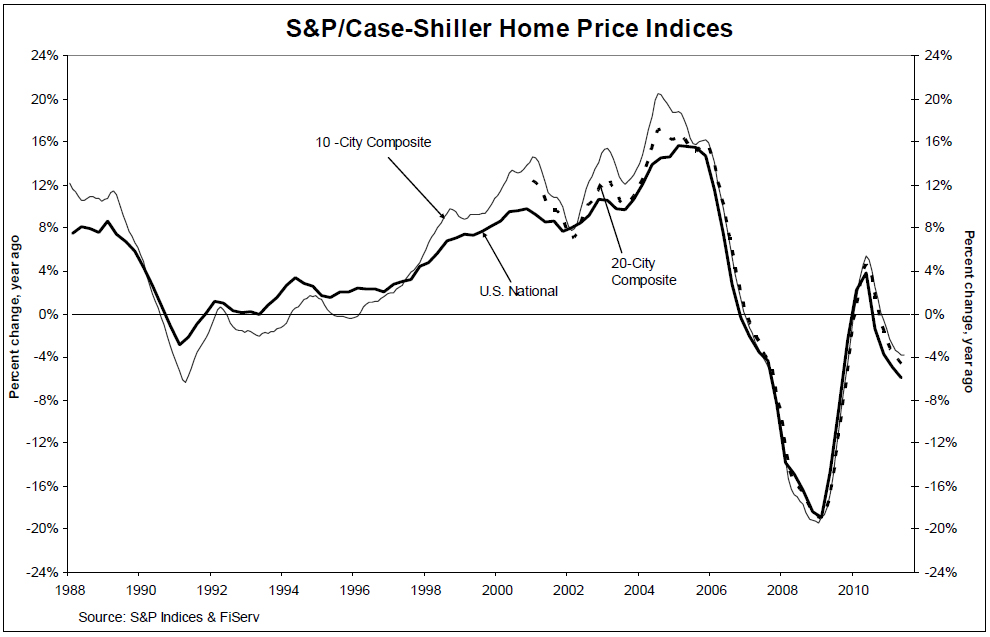
The chart on the previous page depicts the annual returns of the U.S. National, the 10-City Composite and the 20-City Composite Home Price Indices. The S&P/Case-Shiller U.S. National Home Price Index, which covers all nine U.S. census divisions, recorded a 5.9% decline in the second quarter of 2011 over the second quarter of 2010. In June, the 10- and 20-City Composites posted annual rates of decline of 3.8% and 4.5%, respectively. Thirteen of the 20 MSAs and both monthly Composites saw their annual growth rates improve, although remaining in negative territory in June.
"This month's report showed mixed signals for recovery in home prices. No cities made new lows in June 2011, and the majority of cities are seeing improved annual rates. The National Index was up 3.6% from the 2011 first quarter, but down 5.9% compared to a year-ago," says David M. Blitzer, Chairman of the Index Committee at S&P Indices. "Looking across the cities, eight bottomed in 2009 and have remained above their lows. These include all the California cities plus Dallas, Denver and Washington DC, all relatively strong markets. At the other extreme, those which set new lows in 2011 include the four Sunbelt cities - Las Vegas, Miami, Phoenix and Tampa - as well as the weakest of all, Detroit.
These shifts suggest that we are back to regional housing markets, rather than a national housing market where everything rose and fell together.
"As with May's report, June showed unusually large revisions across the same MSAs - Detroit, New York, Tampa and Washington DC. Our sales pairs data indicate that, once again, these markets reported a lot more sales closing in prior months, which caused the revisions. Since deed recording is usually county based, if the price trends across counties are very different, then delays from a subset of counties can lead to larger revisions. And data lag lengths tend to vary across the counties within a metro area. If counties with relatively stronger/weaker markets report sales with longer/shorter lags, this will result in larger revisions as we receive the lagged data. Revisions are also likely to be larger when sales volumes are low or the proportions of distressed/non-distressed sales are changing rapidly. Any and all of these factors are likely contributing to the revisions we have seen over the past few reports.
"Nineteen of the 20 MSAs and both Composites were up in June over May. Portland was flat. Cleveland has improved enough that average home prices in this market are back above its January 2000 levels. Only Detroit and Las Vegas remain below those levels."
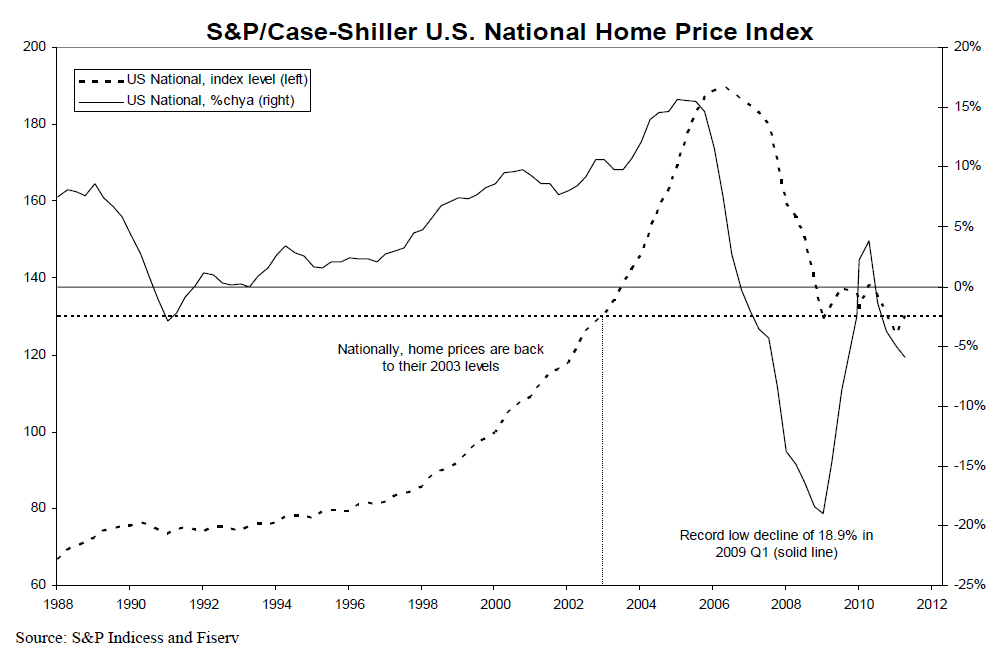
The chart on the previous page shows the index levels for the U.S. National Home Price Index, as well as its annual returns. As of the second quarter of 2011, average home prices across the United States are back at their early 2003 levels. The National Index level had hit a new low in the first quarter of 2011; but recovered by +3.6% in the second quarter. It still remains 5.9% below its 2010Q2 level.
Twelve cities and both Composites have posted three consecutive months of positive month-over-month returns. Eleven of the 20 cities were up 1% or more.
Real Estate Listings Showcase


This website uses cookies to improve user experience. By using our website you consent in accordance with our Cookie Policy. Read More