<?xml version="1.0" encoding="UTF-8"?>
<feed xmlns="http://www.w3.org/2005/Atom">
    <title>WPJ News Center</title>
    <link rel="alternate" type="text/html" href="https://www.worldpropertyjournal.com/" />
<link rel="self" type="application/atom+xml" href="https://www.worldpropertyjournal.com/feed.xml" />
    <id>tag:www.worldpropertyjournal.com,2021-06-15://1</id>
    <updated>2026-05-13T10:03:49Z</updated>
    <subtitle>WORLD PROPERTY JOURNAL is a global web-based News and Property Information media network that distributes quality real estate content (News, Market Data &amp; Property Profiles) to highly targeted audiences on any Internet-enabled device - worldwide.</subtitle>
    <generator uri="http://www.sixapart.com/movabletype/">Movable Type Pro</generator>

<entry>
    <title>Canadian Real Estate Outlook: Which Markets to Watch in 2027</title>
    <link rel="alternate" type="text/html" href="https://www.worldpropertyjournal.com/sponsored-news/canadian-real-estate-outlook-which-markets-to-watch-in-2027-14750.php" />
    <id>tag:www.worldpropertyjournal.com,2026://1.14750</id>

    <published>2026-05-13T11:01:24Z</published>
    <updated>2026-05-13T10:03:49Z</updated>

    <summary>The Canadian housing market enters 2027 in the middle of a slow recovery from the 2024-2026 correction. National sales are forecast to climb 2.1% to roughly 485,071 units in 2027, and the national average price is expected to nudge up 0.9% from 2026 to $695,094. </summary>
    <author>
        <name>Author</name>
        
    </author>
    
        <category term="Press Releases" scheme="http://www.sixapart.com/ns/types#category" />
    
        <category term="Sponsored News" scheme="http://www.sixapart.com/ns/types#category" />
    
    
    <content type="html" xml:lang="en-us" xml:base="https://www.worldpropertyjournal.com/">
        <![CDATA[<p></p>
<p>The Canadian housing market enters 2027 in the middle of a slow recovery from the 2024-2026 correction. National sales are forecast to climb 2.1% to roughly 485,071 units in 2027, and the national average price is expected to nudge up 0.9% from 2026 to $695,094. Those numbers hide a sharp regional split. Alberta and Saskatchewan remain seller's markets with rising prices, Ontario and British Columbia are still working through inventory overhangs, and Quebec is running well above the national pace. The interesting markets in 2027 are not the largest ones.</p>
<p>A buyer or investor reading the 2027 outlook should be paying attention to where supply is constrained, where the macro tailwinds align, and where mortgage renewals are likely to push more inventory onto the market. The five markets below cover the main bands.</p>
<p><strong>The CREA Forecast Baseline</strong></p>
<p>The Canadian Real Estate Association's most recent forecast set 2026 national sales at 474,972 units (+1% over 2025) and pushed the national average price to $688,955 (+1.5%). The 2027 update penciled in another modest gain. The numbers carry meaningful uncertainty. CREA flagged trade tensions, oil price volatility, and an unresolved federal immigration policy pivot as the main wildcards, and an oil shock in early 2026 prompted a downward revision from the prior forecast.</p>
<p>The macro picture is one of stabilization without acceleration. Most provinces are forecast to see price gains held below inflation in 2027.</p>
<p><strong>Alberta as the National Tightest Market</strong></p>
<p>Alberta entered 2026 with 2.8 months of supply, the tightest provincial inventory in the country. Calgary tightened back into seller's market territory in March 2026 after a brief pause, with an average price of $641,844 essentially flat year-over-year and a benchmark of $565,600. Edmonton's average climbed 2.2% to $470,819, with inventory still well below 2024 levels. Both cities continue to absorb out-of-province migration from Ontario and B.C.</p>
<p>The 2027 case for Alberta rests on three things: continued in-migration from higher-cost provinces, a strong oil-and-gas economy supporting household income, and a multi-year supply shortage that new construction has not closed. The risk is an oil price reversal, which would soften both the migration story and the income story.</p>
<p><strong>Toronto and Vancouver in Recovery Mode</strong></p>
<p>Toronto and Vancouver are expected to post 3% to 4% price declines in 2026 before stabilizing in 2027. The recovery hinges on rate cuts that have not yet materialized and an inventory absorption process that is taking longer than the 2024 forecasts assumed. CREA downgraded its 2026 forecast in April 2026 specifically because of the oil shock and tariff uncertainty.</p>
<p>For 2027, the consensus is that Toronto and Vancouver will outperform their 2026 floors but underperform the national average. Sales growth is expected to slow further in Vancouver and Victoria into 2028 due to demographic headwinds and the lingering price-to-income gap.</p>
<p><strong>Edmonton Listing Filters in a Tight Market</strong></p>
<p>Edmonton enters 2027 with rising sales, tightening inventory, and an average price near $471,000, among the lowest of any major Canadian metro. Buyers from out of province who want to position before the next leg up usually start with active inventory, then narrow by neighborhood and property type. A search of <a href="https://wahi.com/ca/en/real-estate/ab/edmonton" target="_blank" rel="noopener">homes for sale in Edmonton</a> returns the current listings across the city, which lets a buyer screen for entry-level detached homes in the $400,000s, mid-tier in the $600,000s, and luxury inventory above $1 million in a single pass.</p>
<p><strong>Montreal and the Quebec Growth Trajectory</strong></p>
<p>Quebec is the strongest provincial growth story going into 2027. Montreal's median single-family price reached $652,250 in March 2026, up 6.9% year-over-year, and the province-wide aggregate is forecast to rise 7% in the fourth quarter of 2026. Royal LePage projects Greater Montreal to hit $676,725 aggregate by year-end. Single-family detached pricing in Montreal is forecast to climb 6% to $796,908.</p>
<p>The Quebec market is benefiting from in-migration, a rebounding condo segment, and stronger affordability than Ontario or B.C. Montreal-area condo prices grew only 1.2% as supply normalized faster, which makes the segment a watch item for 2027 entry buyers.</p>
<p><strong>Saskatchewan and the Affordability Story</strong></p>
<p>Saskatchewan is the smaller version of the Alberta story. Saskatchewan inventory sits more than 45% below the 10-year average across all six economic regions, and the supply crunch has pushed Saskatoon to a record benchmark of $435,200 and Regina to a record $343,700 in March 2026. Both numbers sit well below the national benchmark of $663,828.</p>
<p>For 2027, Saskatchewan offers the best price-to-income ratio of any major Canadian market. The Regina average net monthly income of $3,675 against a benchmark price near $330,900 produces an affordability ratio that Toronto and Vancouver buyers find difficult to believe. The risk for the province is the same as Alberta's, with the addition of population growth that has run below the national rate.</p>
<p><strong>Macroeconomic Variables in the Forecast</strong></p>
<p>The Bank of Canada held its overnight rate at 2.25% through three consecutive decisions in early 2026, and inflation is projected to ease back to the 2% target by 2027. The path of mortgage rates depends on the duration of the oil shock and on the path of trade tensions with the United States and China.</p>
<p>The other major variable is the mortgage renewal wave. More than one million Canadian mortgages are scheduled to renew in 2026, many of them locked in during 2021 at sub-2% rates. Payment shock could push 15% to 20% higher monthly payments on average, with some renewals seeing 25% to 40% increases. Forced selling from these renewals would add inventory to the Toronto and Vancouver markets specifically.</p>
<p><strong>Investor and Buyer Implications</strong></p>
<p>For buyers, the 2027 setup favors Alberta and Saskatchewan on entry pricing, Quebec on growth trajectory, and Ontario and B.C. on the patience-and-discount play if the inventory absorbs slowly. For investors, the cap rate math works best in Edmonton and Saskatoon, where rents have been rising faster than purchase prices.</p>
<p>The wildcard is the macro picture. A faster-than-expected rate cut cycle would lift Toronto and Vancouver disproportionately. A prolonged oil shock would soften Alberta and Saskatchewan. The forecast assumes neither extreme.</p>
<p><strong>A Final Read</strong></p>
<p>The 2027 Canadian market story is one of regional divergence. The national average masks a 7% growth scenario in Quebec, a tight seller's market in Alberta and Saskatchewan, and a slow recovery in the two largest urban centres. Buyers who want to act before the recovery accelerates should look hardest at the Prairie cities and Quebec. Buyers willing to wait for inventory to absorb will find Toronto and Vancouver on better terms than they have seen in five years.</p>
<p></p>]]>
    </content>
</entry>

<entry>
    <title>European Commercial Property Recovery Builds on Income Gains in 2026</title>
    <link rel="alternate" type="text/html" href="https://www.worldpropertyjournal.com/real-estate-news/germany/berlin-real-estate-news/european-commercial-real-estate-data-for-2026-altus-group-european-office-data-for-2026-european-industrial-property-data-for-2026-phil-tily-14751.php" />
    <id>tag:www.worldpropertyjournal.com,2026://1.14751</id>

    <published>2026-05-13T10:24:58Z</published>
    <updated>2026-05-13T09:31:45Z</updated>

    <summary>European commercial real estate continued its gradual recovery into early 2026, logging a seventh straight quarter of value gains as stronger rental income offset the drag from higher yields and persistent investor caution, according to data released by Altus Group.</summary>
    <author>
        <name>David Barley</name>
        
    </author>
    
        <category term="Berlin" scheme="http://www.sixapart.com/ns/types#category" />
    
        <category term="Dublin" scheme="http://www.sixapart.com/ns/types#category" />
    
        <category term="Europe Commercial News" scheme="http://www.sixapart.com/ns/types#category" />
    
        <category term="France" scheme="http://www.sixapart.com/ns/types#category" />
    
        <category term="Germany" scheme="http://www.sixapart.com/ns/types#category" />
    
        <category term="Ireland" scheme="http://www.sixapart.com/ns/types#category" />
    
        <category term="Italy" scheme="http://www.sixapart.com/ns/types#category" />
    
        <category term="London" scheme="http://www.sixapart.com/ns/types#category" />
    
        <category term="Madrid" scheme="http://www.sixapart.com/ns/types#category" />
    
        <category term="Paris" scheme="http://www.sixapart.com/ns/types#category" />
    
        <category term="Rome" scheme="http://www.sixapart.com/ns/types#category" />
    
        <category term="Spain" scheme="http://www.sixapart.com/ns/types#category" />
    
        <category term="United Kingdom" scheme="http://www.sixapart.com/ns/types#category" />
    
    
    <content type="html" xml:lang="en-us" xml:base="https://www.worldpropertyjournal.com/">
        <![CDATA[<p></p>
<p>European commercial real estate continued its gradual recovery into early 2026, logging a seventh straight quarter of value gains as stronger rental income offset the drag from higher yields and persistent investor caution, according to data released by Altus Group.</p>
<p>The firm's Q1 2026 Pan-European valuation dataset, which tracks open-ended diversified funds representing roughly €30 billion in assets across 16 countries, showed commercial property values rising 0.7%. That compares with a 0.4% increase in the prior quarter, pointing to a modest acceleration in the recovery that began in late 2024 after a prolonged two-year downturn in asset prices.</p>
<p>The latest quarterly gains were driven primarily by income growth rather than capital repricing. Cashflow fundamentals added 1.0% to overall value performance, supported by continued increases in both contractual and market rents across major European property sectors. That momentum was partially offset by a second consecutive quarter of outward yield movement, which reduced returns by 0.1% as investors and valuers maintained a cautious stance amid an uneven macroeconomic and geopolitical backdrop.</p>
<p>Over a longer horizon, the recovery remains incomplete. European commercial property values are up 1.7% over the past year, with all gains attributable to income growth. However, the sector still reflects the earlier downturn, with values remaining down 1.6% annually over three years and 0.9% annually over five years, underscoring the scale of the prior correction.</p>
<p>"The quarter's gains underscore a recovery that remains cashflow-led, with improving contract and market rents doing most of the heavy lifting," said Phil Tily, senior vice president at Altus Group. "At the same time, modest outward yield movement is a reflection of ongoing market caution as investors and valuers navigate a complex macro and geopolitical backdrop."</p>
<p>Sector performance was broadly positive, with gains recorded across nearly all property types. Residential, industrial, retail, and alternative assets all advanced, while offices remained a clear laggard.</p>
<p>Residential real estate led performance, rising 1.2% in the quarter. The sector was driven by strong income expansion, with cashflow contributing 2.0% to valuation growth as in-place rents strengthened across key markets. That was partially offset by a 0.8% negative impact from yield expansion, reflecting continued conservatism in pricing assumptions.</p>
<p>Industrial property remained one of the most stable segments in the dataset, increasing 0.7% on the quarter. The sector benefited from steady demand fundamentals, with a 1.0% contribution from cashflow and only a marginal 0.1% drag from yields, reinforcing its role as a consistent performer through the cycle.</p>
<p>Retail assets also rose 0.7%, broadly in line with the market average. Performance was relatively balanced across sub-sectors, with retail parks and warehouse-style formats outperforming. Stable yields and stronger rental growth allowed income gains to translate more directly into valuation increases.</p>
<p>Offices continued to underperform, rising just 0.2% in Q1 2026. While cashflow improved--adding 0.7% to values on the back of stronger prime rents in select locations--this was outweighed by a 0.5% drag from higher capital expenditure requirements. The result highlights ongoing structural challenges in the office sector, including shifting occupier demand and concerns over asset obsolescence.</p>
<p>The strongest performance came from alternative property types. In the "other" category, student accommodation stood out, with values rising 2.5% for the quarter. The segment's gains were entirely income-driven, supported by a 2.1% quarterly rise in market rents and 10.5% year-over-year growth, reinforcing continued demand for purpose-built student housing as a resilient, fundamentals-driven asset class, says Altus Group.</p>
<p></p>]]>
    </content>
</entry>

<entry>
    <title>U.S. Residential Property Sales Remain Flat in April</title>
    <link rel="alternate" type="text/html" href="https://www.worldpropertyjournal.com/real-estate-news/united-states/chicago-real-estate-news/national-association-of-realtors-april-2026-home-sales-data-median-home-price-data-for-april-2026-lawrence-yun-real-estate-news-14749.php" />
    <id>tag:www.worldpropertyjournal.com,2026://1.14749</id>

    <published>2026-05-12T10:01:38Z</published>
    <updated>2026-05-12T09:06:40Z</updated>

    <summary>U.S. existing-home sales edged higher in April 2026, signaling a modest stabilization in the housing market as easing affordability pressures and slightly lower borrowing costs offset still-tight supply conditions, according to data from the National Association of Realtors.</summary>
    <author>
        <name>WPJ Staff</name>
        
    </author>
    
        <category term="Chicago" scheme="http://www.sixapart.com/ns/types#category" />
    
        <category term="North America Residential News" scheme="http://www.sixapart.com/ns/types#category" />
    
        <category term="United States" scheme="http://www.sixapart.com/ns/types#category" />
    
    
    <content type="html" xml:lang="en-us" xml:base="https://www.worldpropertyjournal.com/">
        <![CDATA[<p></p>
<p>U.S. existing-home sales edged higher in April 2026, signaling a modest stabilization in the housing market as easing affordability pressures and slightly lower borrowing costs offset still-tight supply conditions, according to data from the National Association of Realtors.</p>
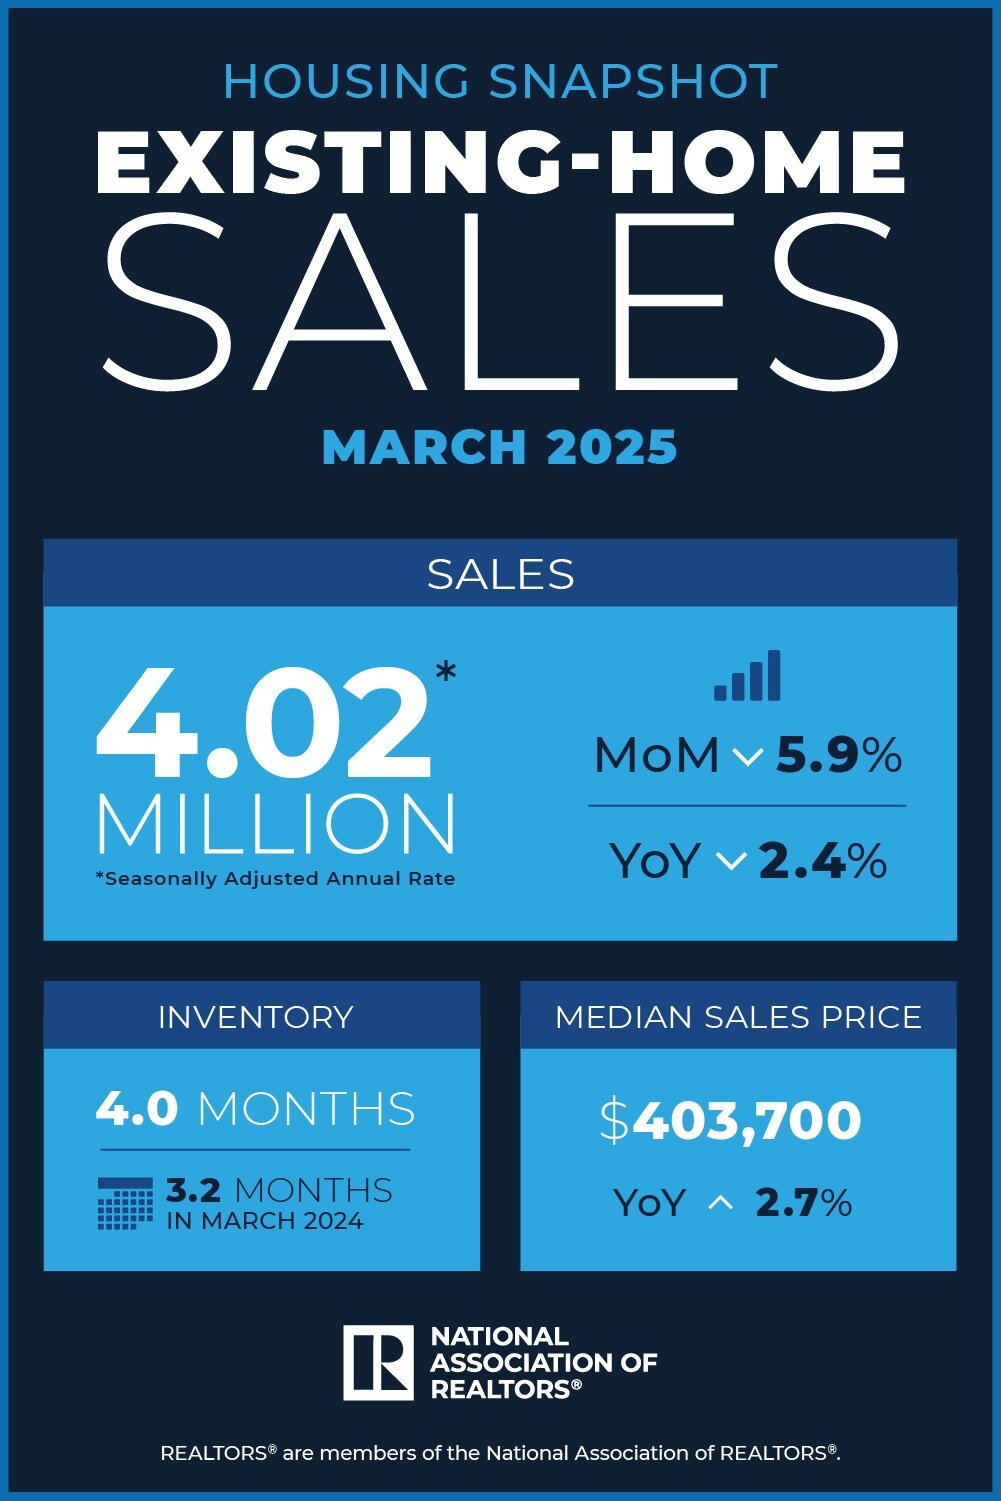
<p>Sales of previously owned homes rose 0.2% from March 2026 to a seasonally adjusted annual rate of 4.02 million, unchanged from a year earlier. The gains were uneven across regions, with strength concentrated in the Midwest and South, flat conditions in the Northeast, and a pullback in the West.</p>
<div class="assets">
<div class="caption text-right"><img style="margin-top: 6px; margin-bottom: 10px;" src="https://www.worldpropertyjournal.com/assets_c/2009/11/lawrence-yun-thumb-150x210-4686.jpg" alt="Thumbnail image for lawrence-yun.jpg" />
<div>Lawrence Yun</div>
</div>
</div>
<p>"Despite mixed macroeconomic signals--including a record-high stock market and historically low consumer confidence--home sales were modestly boosted by the continued improvement in housing affordability," said Lawrence Yun, chief economist at the National Association of Realtors. He noted that mortgage rates have eased from a year ago and income growth continues to outpace home price appreciation.</p>
<p>Still, Yun emphasized that supply constraints remain a defining feature of the market. "Inventory still remains tight," he said, adding that multiple-offer situations persist in some segments, even if competition is less intense than during the pandemic-era peak. Homes are also taking longer to sell on average, suggesting buyers are becoming more selective as conditions normalize.</p>
<p>Inventory rose to 1.47 million units, up 5.8% from March and 1.4% from a year earlier, representing a 4.4-month supply of unsold homes. The median existing-home price climbed to $417,700, up 0.9% year-over-year, marking the 34th consecutive month of annual price gains.</p>
<p>Affordability improved meaningfully. The Housing Affordability Index rose to 110.6 from 101.4 a year ago, with all regions posting year-over-year gains, led by the West.</p>
<p>Mortgage conditions remain a key swing factor. The average 30-year fixed-rate mortgage stood at 6.33% in April, according to Freddie Mac, down from last year but slightly higher than March.</p>
<p>Single-family home sales were unchanged on the month at a 3.64 million annualized pace, while condo and co-op sales rose 2.7% to 380,000. Price trends remained broadly firm, with single-family homes up 1.0% year-over-year and condos rising 1.1%.</p>
<p>Regionally, the South posted the strongest annual performance with sales up 2.7%, while the West was flat. The Northeast saw an 8.2% annual decline, though prices in the region continued to rise. The Midwest recorded a 1.0% yearly decline despite monthly gains.</p>
<p>Market behavior indicators suggest a gradual normalization. Median days on market fell to 32 from 41 in March but remained higher than a year earlier. First-time buyers accounted for 33% of transactions, slightly higher than the prior month, while cash deals and investor activity both eased.</p>
<p>Distressed sales remained minimal at 2% of total transactions, unchanged from prior months, underscoring continued stability in credit conditions despite broader economic uncertainty.</p>]]>
    </content>
</entry>

<entry>
    <title>Japan&apos;s 9 Million Abandoned Homes Are Turning into an Economic Crisis</title>
    <link rel="alternate" type="text/html" href="https://www.worldpropertyjournal.com/real-estate-news/japan/tokyo-real-estate-news/japan-empty-houses-data-in-2026-akiya-ministry-of-internal-affairs-and-communications-japan-2026-real-estate-sales-data-akiya-banks-14748.php" />
    <id>tag:www.worldpropertyjournal.com,2026://1.14748</id>

    <published>2026-05-11T10:08:38Z</published>
    <updated>2026-05-11T09:05:21Z</updated>

    <summary>Across Japan&apos;s shrinking rural towns and aging suburban districts, abandoned homes are quietly reshaping the country&apos;s property market, forcing policymakers, banks, developers, and local governments to confront the unintended consequences of demographic decline.</summary>
    <author>
        <name>Michael Gerrity</name>
        
    </author>
    
        <category term="Asia Pacific Residential News" scheme="http://www.sixapart.com/ns/types#category" />
    
        <category term="Japan" scheme="http://www.sixapart.com/ns/types#category" />
    
        <category term="Kyoto" scheme="http://www.sixapart.com/ns/types#category" />
    
        <category term="Nagoya" scheme="http://www.sixapart.com/ns/types#category" />
    
        <category term="Osaka" scheme="http://www.sixapart.com/ns/types#category" />
    
        <category term="Tokyo" scheme="http://www.sixapart.com/ns/types#category" />
    
        <category term="Yokohama" scheme="http://www.sixapart.com/ns/types#category" />
    
    
    <content type="html" xml:lang="en-us" xml:base="https://www.worldpropertyjournal.com/">
        <![CDATA[<p></p>
<p>Across Japan's shrinking rural towns and aging suburban districts, abandoned homes are quietly reshaping the country's property market, forcing policymakers, banks, developers, and local governments to confront the unintended consequences of demographic decline.</p>
<p>Japan now has roughly 9 million vacant homes -- known locally as "akiya" -- according to the country's Ministry of Internal Affairs and Communications, representing about 14% of the nation's housing stock. In many prefectures, entire neighborhoods are gradually hollowing out as elderly homeowners die and younger heirs decline to occupy or maintain inherited properties.</p>
<p>What began as a rural issue has evolved into a broader structural challenge for the world's third-largest economy.</p>
<p>For decades, Japan's population decline and rapid urbanization have concentrated economic opportunity in major metropolitan centers such as Tokyo, Osaka, and Nagoya, while smaller regional cities and villages steadily lost residents. Younger generations migrated toward employment hubs, leaving behind aging parents and family homes that often carried more emotional attachment than financial value.</p>
<p>When those properties pass through inheritance, heirs frequently discover the economics no longer make sense.</p>
<p>Many older homes require extensive renovations to meet modern earthquake standards or energy-efficiency expectations. Annual maintenance costs, property taxes, insurance expenses, and legal complexities surrounding inherited ownership can quickly exceed the market value of the structure itself. In some rural regions, homes are effectively worth less than the land beneath them.</p>
<p>The result is a growing inventory of neglected properties that local governments increasingly view as both an economic and public-safety burden.</p>
<p>Vacant homes have become associated with collapsing roofs, overgrown vegetation, fire hazards, and declining neighborhood aesthetics, placing downward pressure on surrounding property values. Municipalities across Japan are spending more resources monitoring deteriorating structures and, in some cases, subsidizing demolitions.</p>
<p>The phenomenon is also exposing a widening divide within Japan's housing market.</p>
<p>While central Tokyo condominium prices have continued climbing amid foreign investment and limited supply, large portions of regional Japan face the opposite dynamic: chronic oversupply and weakening demand. Some municipalities have responded by creating "akiya banks," publicly searchable databases of abandoned homes offered at heavily discounted prices, with certain properties listed for little more than the equivalent of a few thousand dollars.</p>
<p>In extreme cases, local governments and private owners have transferred homes at virtually no cost in exchange for commitments to renovate or occupy the property.</p>
<p>The abandoned-home crisis is beginning to alter broader assumptions about Japanese real estate itself. Unlike in many Western markets where homes are often viewed as appreciating family assets, Japanese residential structures historically depreciate rapidly, with buyers placing greater value on land than on aging buildings. Demographic contraction is accelerating that trend outside major urban corridors.</p>
<p>Financial institutions are also watching closely. As rural property values stagnate or decline, lenders face increasing questions about long-term collateral quality in depopulating regions. Developers, meanwhile, are redirecting investment toward dense urban redevelopment projects rather than new suburban expansion.</p>
<p>Tokyo has largely remained insulated from the worst effects due to continued migration into the capital. But economists warn that the broader imbalance between urban concentration and regional decline is becoming increasingly difficult to reverse.</p>
<p>For Japan, the rise of millions of abandoned homes is no longer simply a housing issue. It has become a visible symbol of the country's demographic transformation -- and a growing test of how an advanced economy manages contraction after decades of growth.</p>
<p></p>
<p></p>]]>
    </content>
</entry>

<entry>
    <title>Commercial Property Lending Rebounds 52 Percent in U.S.</title>
    <link rel="alternate" type="text/html" href="https://www.worldpropertyjournal.com/real-estate-news/united-states/new-york-city-real-estate-news/commercial-mortgage-lending-data-for-2026-commercial-real-estate-mortgage-originations-data-cmbs-data-mortgage-bankers-association-reggie-booker-14747.php" />
    <id>tag:www.worldpropertyjournal.com,2026://1.14747</id>

    <published>2026-05-08T10:09:24Z</published>
    <updated>2026-05-08T09:15:16Z</updated>

    <summary>Commercial and multifamily mortgage lending surged in early 2026, with originations rising sharply from a year earlier as banks stepped back into the market to refinance maturing debt, according to new data from the Mortgage Bankers Association.</summary>
    <author>
        <name>Michael Gerrity</name>
        
    </author>
    
        <category term="New York City" scheme="http://www.sixapart.com/ns/types#category" />
    
        <category term="North America Commercial News" scheme="http://www.sixapart.com/ns/types#category" />
    
        <category term="United States" scheme="http://www.sixapart.com/ns/types#category" />
    
    
    <content type="html" xml:lang="en-us" xml:base="https://www.worldpropertyjournal.com/">
        <![CDATA[<p></p>
<h3 class="sub-title">Banks Drive Refinancing Wave in 2026, Says MBA</h3>
<p></p>
<p>Commercial and multifamily mortgage lending surged in early 2026, with originations rising sharply from a year earlier as banks stepped back into the market to refinance maturing debt, according to new data from the Mortgage Bankers Association.</p>
<p>Total originations increased 52% in the first quarter of 2026 compared with the same period in 2025, marking a broad recovery in transaction activity across major property types. However, lending volumes fell 30% from the fourth quarter of 2025, a pullback the association attributed largely to normal seasonal patterns rather than a deterioration in credit conditions.</p>
<p>"Commercial and multifamily originations increased 52 percent on an annual basis in the first quarter of 2026, reflecting a meaningful rebound in lending activity," said Reggie Booker, associate vice president of commercial research at the MBA. He pointed to an 80% jump in depository lending, driven by a wave of bank-held loans reaching maturity and needing refinancing. "While overall activity declined from the fourth quarter of 2025, that slowdown is consistent with typical first-quarter seasonality," he added.</p>
<p>The annual gains were led by sharp increases in lending tied to healthcare, retail, hotel, industrial, and multifamily assets. Healthcare property lending posted the strongest growth, surging 209% from a year earlier, followed by retail at 148%, hotels at 85%, industrial at 56%, and multifamily at 49%. Office lending was the only major segment to decline year over year, slipping 2%.</p>
<p>Investor composition also shifted notably. Lending to investor-driven lenders more than doubled, rising 133% year over year. Depository institutions increased lending by 80%, while government-sponsored enterprises including Fannie Mae and Freddie Mac grew 38%. Life insurance company lending rose 9%, while commercial mortgage-backed securities (CMBS) issuance fell 14%, underscoring continued caution in securitized markets.</p>
<p>Despite the year-over-year strength, quarterly comparisons showed broad cooling from the end of 2025. Multifamily originations fell 28% from the fourth quarter, mirroring declines of 28% in office and industrial lending and a 5% drop in retail. Hotel lending was a relative outlier, rising 3%, while healthcare originations jumped 70%, reflecting uneven momentum across property sectors.</p>
<p>By lender type, the quarterly slowdown was widespread. Depository lending dropped 37%, life insurance lending fell 36%, GSE activity declined 35%, CMBS originations were down 23%, and investor-driven lenders saw an 18% reduction.</p>
<p>Taken together, the data points to a market in transition: a strong year-over-year rebound driven by refinancing demand and selective sector strength, offset by a typical seasonal slowdown and lingering caution in securitized and institutional capital channels.</p>
<p></p>]]>
    </content>
</entry>

<entry>
    <title>Las Vegas Housing Market Cools Further in April</title>
    <link rel="alternate" type="text/html" href="https://www.worldpropertyjournal.com/real-estate-news/united-states/las-vegas/las-vegas-home-price-data-for-april-2026-las-vegas-home-sales-date-for-april-2026-las-vegas-realtors-george-kypreos-14746.php" />
    <id>tag:www.worldpropertyjournal.com,2026://1.14746</id>

    <published>2026-05-07T09:00:02Z</published>
    <updated>2026-05-07T09:08:46Z</updated>

    <summary>Home prices and sales in the Las Vegas area declined in April 2026, from a year earlier, the latest sign that one of the nation&apos;s hottest housing markets in recent years is continuing to normalize as inventory builds and affordability pressures linger.</summary>
    <author>
        <name>Michael Gerrity</name>
        
    </author>
    
        <category term="Las Vegas" scheme="http://www.sixapart.com/ns/types#category" />
    
        <category term="North America Residential News" scheme="http://www.sixapart.com/ns/types#category" />
    
        <category term="United States" scheme="http://www.sixapart.com/ns/types#category" />
    
    
    <content type="html" xml:lang="en-us" xml:base="https://www.worldpropertyjournal.com/">
        <![CDATA[<p></p>
<h3 class="sub-title">Home Prices, Sales Slip Amid Rising Inventories</h3>
<p></p>
<p>Home prices and sales in the Las Vegas area declined in April 2026, from a year earlier, the latest sign that one of the nation's hottest housing markets in recent years is continuing to normalize as inventory builds and affordability pressures linger.</p>
<p>The median price of existing single-family homes sold through the Multiple Listing Service in Southern Nevada fell 1.3% from April 2025 to $473,875, according to a report released Wednesday by the Las Vegas Realtors association. That figure sits below the record high of $488,995 reached in November 2025. Prices for condos and townhomes dropped more sharply, declining 4.2% to $290,000, well off their peak of $315,000 in October 2024.</p>
<p>Sales activity also softened. A total of 2,643 existing homes, condos and townhomes changed hands in April, with single-family home sales down 2.9% and condo/townhome transactions off 2.0% from the prior year. The pullback extends a broader trend of subdued activity that began after the 2021 boom, when transaction volumes topped 50,000 properties. Last year marked the lowest annual total since 2007.</p>
<p><strong>Inventory Continues to Climb</strong></p>
<p>The market is gradually shifting toward balance after years of severe shortages. By the end of April, 6,689 single-family homes were listed for sale without pending offers, up 7.7% from a year earlier. Listings of condos and townhomes without offers rose 7.9% to 2,580 units. At the current sales pace, the market had roughly 3.5 months of housing supply, up from just over three months a year ago.</p>
<p>"Data shows the local housing market is softening a bit, especially at lower price points," said George Kypreos, president of Las Vegas Realtors. "But when you look at the big picture, demand for homes here remains strong... we still have fewer than 10,000 properties ready for sale. That's not a lot in a community of about 2.5 million people."</p>
<p><strong>Market Indicators Point to Moderation</strong></p>
<p>Other metrics reflected a cooling but still functional market. The share of single-family homes selling within 60 days fell to 75.3% from 81.1% a year earlier, while the comparable figure for condos and townhomes edged down to 73.0% from 75.1%. Cash buyers accounted for 22.1% of transactions, down from 23.2% last year and far below peaks seen during the pandemic-era frenzy.</p>
<p>Distressed sales remained minimal, with short sales and foreclosures making up just 1.0% of activity, a slight increase from 0.7% the prior year. Total dollar volume for single-family homes exceeded $1.3 billion, down 0.8% year-over-year, while condo and townhome sales volume fell 5.6% to $159 million.</p>
<p>The softening comes as Southern Nevada--among the fastest-growing U.S. metropolitan areas--grapples with higher borrowing costs and stretched affordability, particularly for entry-level buyers. Yet underlying demand has held up better than in many other Sun Belt markets that experienced sharper reversals after the post-pandemic surge.</p>
<p>Analysts and local real-estate professionals continue to watch whether the gradual increase in supply will lead to more meaningful price adjustments in the months ahead, or if steady population inflows will underpin a floor for values. For now, the data point to a market in transition: no longer white-hot, but far from distressed.</p>
<p></p>]]>
    </content>
</entry>

<entry>
    <title>U.S. New Home Sales Uptick in March</title>
    <link rel="alternate" type="text/html" href="https://www.worldpropertyjournal.com/real-estate-news/united-states/phoenix/us-new-home-sales-data-for-march-2026-bill-owens-national-association-of-home-builders-march-2026-new-home-sales-report-danushka-nanayakkara-skillingt-14745.php" />
    <id>tag:www.worldpropertyjournal.com,2026://1.14745</id>

    <published>2026-05-06T10:37:04Z</published>
    <updated>2026-05-06T10:40:43Z</updated>

    <summary>U.S. new home sales rose in March 2026, supported by limited supply in the resale market and a modest easing in mortgage rates, offering a tentative sign of stabilization in housing demand even as affordability pressures persist.</summary>
    <author>
        <name>David Barley</name>
        
    </author>
    
        <category term="North America Residential News" scheme="http://www.sixapart.com/ns/types#category" />
    
        <category term="Phoenix" scheme="http://www.sixapart.com/ns/types#category" />
    
        <category term="United States" scheme="http://www.sixapart.com/ns/types#category" />
    
    
    <content type="html" xml:lang="en-us" xml:base="https://www.worldpropertyjournal.com/">
        <![CDATA[<p></p>
<p>U.S. new home sales rose in March 2026, supported by limited supply in the resale market and a modest easing in mortgage rates, offering a tentative sign of stabilization in housing demand even as affordability pressures persist.</p>
<p>Sales of newly built single-family homes increased 7.4% last month to a seasonally adjusted annual rate of 682,000, according to data released jointly by the U.S. Department of Housing and Urban Development and the Census Bureau. The pace was 3.3% higher than a year earlier.</p>
<p>The pickup comes as buyers face constrained inventory in the existing-home market, prompting greater reliance on new construction despite still-elevated borrowing costs. Industry participants say builders are responding cautiously, balancing improving demand conditions against persistent cost and labor constraints.</p>
<p>"An uptick in new home sales reflects improving demand conditions, supported by a modest pullback in mortgage rates and ongoing supply constraints in the existing home market," said Bill Owens, chairman of the National Association of Home Builders. He added that while production is gradually increasing, elevated construction costs and labor shortages continue to limit expansion.</p>
<p>Inventory of new single-family homes edged lower, falling 0.4% from February to 481,000 units, down 4.6% from a year earlier. That represents an 8.5-month supply at the current sales pace, signaling a market that remains above equilibrium despite tightening year-over-year stock levels.</p>
<p>Pricing softened further. The median new home price declined 6.2% from a year earlier to $387,400, extending a pullback from the recent peak of $429,100 reached in December 2025. Completed, move-in-ready homes totaled 119,000 units, up 5.3% year over year, indicating builders are increasingly focused on delivering finished inventory to attract buyers.</p>
<p>Looking ahead, analysts expect modest near-term support for residential construction, though momentum remains closely tied to interest rate trends and affordability dynamics.</p>
<p>"The rise in new home sales points to a modest strengthening in residential construction activity in the near term," said Danushka Nanayakkara-Skillington, assistant vice president for forecasting and analysis at the NAHB. "However, the outlook remains sensitive to interest rate movements and affordability conditions, which will ultimately determine the sustainability of this momentum."</p>
<p>Regionally, performance remained uneven. On a year-to-date basis, new home sales rose 8.0% in the Midwest, while declining 17.6% in the Northeast, 2.6% in the South, and 14.0% in the West, underscoring persistent geographic divergence in housing demand.</p>
<p></p>]]>
    </content>
</entry>

<entry>
    <title>How to Minimize Downtime During an Office Relocation</title>
    <link rel="alternate" type="text/html" href="https://www.worldpropertyjournal.com/sponsored-news/how-to-minimize-downtime-during-an-office-relocation-14744.php" />
    <id>tag:www.worldpropertyjournal.com,2026://1.14744</id>

    <published>2026-05-05T20:21:06Z</published>
    <updated>2026-05-06T11:12:39Z</updated>

    <summary>Office moves tend to look organized on paper. Timelines are set, tasks are assigned, and it all seems manageable. But once the move actually begins, small gaps in planning start to show. Those gaps are usually where downtime comes from, not from the move itself, but from what was not fully accounted for.</summary>
    <author>
        <name>Author</name>
        
    </author>
    
        <category term="Press Releases" scheme="http://www.sixapart.com/ns/types#category" />
    
        <category term="Sponsored News" scheme="http://www.sixapart.com/ns/types#category" />
    
    
    <content type="html" xml:lang="en-us" xml:base="https://www.worldpropertyjournal.com/">
        <![CDATA[<p></p>
<p>Office moves tend to look organized on paper. Timelines are set, tasks are assigned, and it all seems manageable. But once the move actually begins, small gaps in planning start to show. Those gaps are usually where downtime comes from, not from the move itself, but from what was not fully accounted for.</p>
<p>In places like San Francisco, that challenge can feel sharper because of how the city moves. Traffic patterns shift throughout the day, commercial routes can get tight, and local regulations around business operations and transport can add extra steps that are easy to overlook. All of that makes timing more sensitive, especially when a business is trying to stay operational through the move.</p>
<p><strong>Planning Beyond the Move Itself</strong></p>
<p>Most businesses focus heavily on the moving day. What gets less attention is everything around it. The days before and after tend to shape how much downtime actually occurs. A move plan should not just cover packing and transport. It needs to include how work continues during the transition. Which teams stay active? Which systems need to remain accessible? What gets moved first, and what stays until the end? When this part is skipped or rushed, people arrive at the new space without what they need to work.</p>
<p><strong>Why Coordination Matters More Than Speed</strong></p>
<p>There is often a push to complete the move as quickly as possible. Faster move, less disruption. But speed without coordination usually creates more problems than it solves.</p>
<p>What matters more is how each step connects to the next. Equipment should arrive in the order it is needed. Workstations should be set up in a way that allows teams to resume quickly. Even something as simple as labeling boxes clearly can save hours later. For many businesses, this is where external support becomes part of the process. Working with <a href="https://www.ontrackmoving.com/san-francisco-office-movers" target="_blank" rel="noopener">San Francisco office movers</a> ensures the move is smooth and all roadblocks are handled efficiently. It is less about outsourcing the work and more about keeping the transition structured enough to avoid unnecessary downtime.</p>
<p><strong>Keeping Systems Active During the Transition</strong></p>
<p>Physical movement is only one part of an office relocation. The other part, often more critical, is maintaining access to digital systems. Servers, networks, and communication tools need to stay active as long as possible. In some cases, temporary setups are used to keep operations running while the main systems are moved and reinstalled.</p>
<p>This requires coordination between IT teams and the moving schedule. If systems go offline too early, work stops. If they are brought back too late, delays continue into the new location. Planning this overlap carefully helps reduce the gap between shutdown and restart.</p>
<p><strong>Preparing Teams for the Disruption</strong></p>
<p>Even with a solid plan, there will be some disruption. The difference is how prepared people are for it. Employees should know what to expect, not just in terms of timing, but in terms of how their work will be affected. Clear communication reduces confusion. It also helps people adjust their tasks around the move.</p>
<p>Recent SEC data indicate that 593 companies, representing 8.9% of the approximately 6,700 publicly traded firms in the U.S., relocated their headquarters during the past fiscal year. Some businesses shift to remote work for a short period, while others move to physical locations permanently. Some adjust workloads in advance, completing time-sensitive tasks before the move begins. These adjustments are not always perfect, but they reduce the impact when the physical move takes place.</p>
<p><strong>Setting Up the New Space with Intention</strong></p>
<p>The new office is often treated as the endpoint, but in practice, it is another phase of the move. If the setup is rushed, people arrive at incomplete workstations, missing equipment, or layouts that do not match how teams actually work. That leads to more adjustments, which adds time.</p>
<p>Taking the time to set up key areas first tends to make a difference. Workstations that are ready to use. Meeting spaces that are functional. Basic systems that are already tested. It does not need to be perfect. It just needs to be usable from the start.</p>
<p><strong>Allowing for Small Delays Without Losing Control</strong></p>
<p>No matter how detailed the plan is, something will not go exactly as expected. A delay in transport, a missing item, a system that takes longer to reconnect. The goal is not to eliminate every issue. It is to prevent those issues from spreading.</p>
<p>Building a bit of flexibility into the schedule helps. Having backup options, even simple ones, keeps things moving when something slows down. Without that flexibility, small problems tend to create larger disruptions.</p>
<p><strong>The Role of Timing in Reducing Downtime</strong></p>
<p>Timing affects everything during a move. When the move starts, how long it takes, and when operations resume. Some businesses choose to move outside regular working hours. Others split the move across phases, keeping part of the office active while another part transitions.</p>
<p>There is no single approach that works for every situation. What matters is aligning the timing with how the business operates. When timing is planned around actual workflows, rather than just convenience, downtime tends to decrease.</p>
<p>Downtime is often treated as something unavoidable, a natural part of moving. To some extent, that is true. There will always be some interruption. But most of it comes from how the move is handled, not from the move itself. When planning is detailed, coordination is clear, and expectations are set early, downtime becomes more controlled. It does not disappear, but it stops expanding into something larger.</p>
<p></p>]]>
    </content>
</entry>

<entry>
    <title>U.S. Housing Market Shows Continued Strain in April: Top 10 Takeaways</title>
    <link rel="alternate" type="text/html" href="https://www.worldpropertyjournal.com/real-estate-news/united-states/irvine/april-2026-housing-market-data-cotality-april-2026-housing-report-april-2026-home-prices-inflation-impact-on-home-prices-14743.php" />
    <id>tag:www.worldpropertyjournal.com,2026://1.14743</id>

    <published>2026-05-05T10:03:17Z</published>
    <updated>2026-05-05T10:08:47Z</updated>

    <summary>The U.S. housing market is entering the second quarter with mounting signs of fatigue, as affordability pressures intensify and sellers begin to lose leverage.</summary>
    <author>
        <name>Michael Gerrity</name>
        
    </author>
    
        <category term="Irvine" scheme="http://www.sixapart.com/ns/types#category" />
    
        <category term="North America Residential News" scheme="http://www.sixapart.com/ns/types#category" />
    
        <category term="United States" scheme="http://www.sixapart.com/ns/types#category" />
    
    
    <content type="html" xml:lang="en-us" xml:base="https://www.worldpropertyjournal.com/">
        <![CDATA[<p></p>
<p>The U.S. housing market is entering the second quarter with mounting signs of fatigue, as affordability pressures intensify and sellers begin to lose leverage. Data released by Cotality point to a market that is no longer surging--but not yet correcting--caught between elevated home values and rising ownership costs.</p>
<p>While prices remain far above pre-pandemic levels, the pace of growth has slowed to a near standstill. At the same time, higher insurance premiums, property taxes, and mortgage frictions are reshaping both buyer and investor behavior. Below are the 10 key developments, compiled by Cotality, defining the U.S. housing market in April 2026.</p>
<p><strong>1. Price growth is effectively flat -</strong> After months of modest declines, home prices are stabilizing. February posted a marginal 0.04% gain, with early March data pointing to a 0.34% increase. The shift suggests a market searching for equilibrium rather than accelerating in either direction.</p>
<p><strong>2. Sellers are cutting prices -</strong> Listings are coming to market at lower price points, down 1.1% year-over-year. That signals weakening seller power after years of dominance, particularly as buyers push back against affordability constraints.</p>
<p><strong>3. Prices remain historically elevated -</strong> Despite the slowdown, U.S. home prices are still roughly 48% higher than pre-pandemic levels--keeping ownership out of reach for many first-time buyers and locking in affordability stress.</p>
<p><strong>4. Regional divergence is widening -</strong> Lower-cost markets continue to outperform. Cities like Knoxville and Camden have seen price gains above 80% since 2020, while major coastal metros--including San Francisco and Washington--have lagged with sub-25% increases.</p>
<p><strong>5. California inventory is tightening -</strong> New listings across California fell 10% year-over-year in the first quarter, with inventory down 11%. Major metros such as San Diego and San Francisco recorded double-digit declines in listings, underscoring persistent supply constraints.</p>
<p><strong>6. Home equity is high--but largely untapped -</strong> Homeowners are sitting on record levels of equity, yet access remains limited. California alone holds about a quarter of U.S. tappable equity but accounts for only about 12% of active HELOC balances--highlighting a disconnect between wealth and liquidity.</p>
<p><strong>7. Rent growth is cooling -</strong> The rental market is softening, with single-family rents rising just 1.1% year-over-year. Higher-end rentals are proving more resilient, while some markets--including Los Angeles--are beginning to post annual declines, signaling normalization after prior spikes.</p>
<p><strong>8. Escrow costs are driving payment shocks -</strong> Rising insurance and property taxes are pushing monthly housing costs higher. About 65% of homeowners are expected to face escrow shortages in 2026, with average monthly payments increasing by roughly $175. States like Florida and Colorado are seeing some of the sharpest increases.</p>
<p><strong>9. Institutional investors are stepping back -</strong> Investor purchases accounted for 27% of single-family home sales in March, down slightly from a year earlier. Notably, large-scale investors--those with portfolios exceeding 1,000 homes--have cut their market share in half, suggesting caution amid potential regulatory changes.</p>
<p><strong>10. Mortgage market stress is rising -</strong> Serious delinquencies are ticking higher, reaching 1.14% in February. Loans backed by the Federal Housing Administration show the greatest strain, with delinquency rates climbing sharply year-over-year, even as conventional loans remain relatively stable.</p>
<p><strong>Bottom line</strong></p>
<p>The U.S. housing market is no longer overheating--but it isn't easing meaningfully either. Elevated prices, rising ownership costs, and shifting investor dynamics are combining to create a prolonged affordability squeeze, leaving the market in a slow-moving recalibration rather than a sharp correction.</p>
<p></p>
<div class="assets"><a href="https://www.worldpropertyjournal.com/assets_c/2026/05/unnamed%20%2875%29-36664.php" data-test="popup-now" onclick="window.open('https://www.worldpropertyjournal.com/assets_c/2026/05/unnamed%20%2875%29-36664.php','popup','width=899,height=553,scrollbars=yes,resizable=no,toolbar=no,directories=no,location=no,menubar=no,status=no,left=0,top=0'); return false"><img src="https://www.worldpropertyjournal.com/assets_c/2026/05/unnamed%20%2875%29-thumb-899x552-36664.png" style="width: 100%;" alt="unnamed (75).png" class="mt-image-none" loading="lazy" decoding="async" /></a></div>
<p></p>]]>
    </content>
</entry>

<entry>
    <title>AI Fuels Revival in San Francisco Luxury Housing Market in 2026</title>
    <link rel="alternate" type="text/html" href="https://www.worldpropertyjournal.com/real-estate-news/united-states/san-francisco-real-estate-news/san-francisco-luxury-housing-market-data-for-2026-ai-impact-on-san-francisco-housing-market-redfin-san-francisco-housing-market-report-san-francisco-l-14742.php" />
    <id>tag:www.worldpropertyjournal.com,2026://1.14742</id>

    <published>2026-05-05T09:57:06Z</published>
    <updated>2026-05-05T10:08:47Z</updated>

    <summary>San Francisco&apos;s luxury housing market is staging a powerful comeback--one increasingly defined by the rise of artificial intelligence and the wealth it is generating, according to new data from Redfin.</summary>
    <author>
        <name>Michael Gerrity</name>
        
    </author>
    
        <category term="North America Residential News" scheme="http://www.sixapart.com/ns/types#category" />
    
        <category term="San Francisco" scheme="http://www.sixapart.com/ns/types#category" />
    
        <category term="United States" scheme="http://www.sixapart.com/ns/types#category" />
    
    
    <content type="html" xml:lang="en-us" xml:base="https://www.worldpropertyjournal.com/">
        <![CDATA[<p></p>
<h3 class="sub-title">Median Prices Climb to $6.8 Million in March as Demand Surges </h3>
<p></p>
<p>San Francisco's luxury housing market is staging a powerful comeback--one increasingly defined by the rise of artificial intelligence and the wealth it is generating, according to new data from Redfin.</p>
<p>Sales of high-end homes in San Francisco climbed 22.2% in March 2026 from a year earlier, the fifth consecutive month of double-digit gains and among the strongest increases across major U.S. metros. By contrast, non-luxury sales rose just 3.8%, underscoring a widening gap in demand.</p>
<p>At the center of the rebound is AI--now acting as an economic engine for the city's housing market after years of uncertainty. The rapid expansion of firms such as OpenAI and Anthropic has created a new class of ultra-high-earning buyers, many of whom are channeling unprecedented compensation packages into real estate.</p>
<p>That influx of capital is translating directly into price growth. The median luxury home sold for $6.81 million in March, up 9% from a year earlier and the highest level ever recorded for this time of year, according to Redfin. Prices for non-luxury homes were effectively flat.</p>
<p>The speed of the market tells a similar story. Luxury homes went under contract in just 12 days on average--down sharply from 28 days a year earlier and the fastest pace among the largest U.S. cities. Nearly two-thirds of high-end homes sold within two weeks, the highest share in more than a decade.</p>
<p>The resurgence marks a sharp reversal from pandemic-era fears that San Francisco's housing market faced a prolonged decline as residents decamped for lower-cost regions. Instead, AI has reshaped the city's economic foundation, pulling talent--and wealth--back in.</p>
<p>Inventory constraints are amplifying the effect. The number of luxury homes for sale fell more than 15% from a year earlier, extending a multi-year contraction in supply. While new listings are beginning to tick higher as sellers try to capitalize on rising prices, demand continues to outstrip availability, intensifying competition and driving bidding wars.</p>
<p>The result is a market where AI is not just supporting demand--it is effectively resetting the ceiling for what buyers are willing and able to pay.</p>
<p><strong>Nationally, however, the picture remains far more subdued.</strong></p>
<p>Across the U.S., luxury home sales fell 2.4% in March, while prices rose 3.6% to about $1.4 million--the slowest growth rate in five years. Higher borrowing costs and persistent economic uncertainty, including geopolitical tensions tied to the conflict involving Iran, are keeping many would-be buyers on the sidelines.</p>
<p>Elsewhere, gains are uneven. Luxury prices rose most in Tampa, Philadelphia and Kansas City, while sales activity surged in Tampa and Detroit. In contrast, transaction volumes declined sharply in Los Angeles and parts of the New York metro area.</p>
<p>The divergence highlights how localized forces are increasingly shaping U.S. housing outcomes. In San Francisco, the AI boom has not only stabilized the luxury market--it has reignited it, transforming a once-questioned recovery into one of the strongest performances in the country.</p>
<p></p>
<div class="assets"><a href="https://www.worldpropertyjournal.com/assets_c/2026/05/San%20Francisco%20Luxury%20Housing%20Market%20Chart%20%282026%29-36658.php" data-test="popup-now" onclick="window.open('https://www.worldpropertyjournal.com/assets_c/2026/05/San%20Francisco%20Luxury%20Housing%20Market%20Chart%20%282026%29-36658.php','popup','width=1301,height=579,scrollbars=yes,resizable=no,toolbar=no,directories=no,location=no,menubar=no,status=no,left=0,top=0'); return false"><img src="https://www.worldpropertyjournal.com/assets_c/2026/05/San%20Francisco%20Luxury%20Housing%20Market%20Chart%20%282026%29-thumb-1301x578-36658.png" style="width: 100%;" alt="San Francisco Luxury Housing Market Chart (2026).png" class="mt-image-none" loading="lazy" decoding="async" /></a></div>
<p></p>
<div class="assets"><a href="https://www.worldpropertyjournal.com/assets_c/2026/05/San%20Francisco%20Luxury%20Housing%20Market%20Prices%20Chart%20%282026%29-36661.php" data-test="popup-now" onclick="window.open('https://www.worldpropertyjournal.com/assets_c/2026/05/San%20Francisco%20Luxury%20Housing%20Market%20Prices%20Chart%20%282026%29-36661.php','popup','width=1280,height=529,scrollbars=yes,resizable=no,toolbar=no,directories=no,location=no,menubar=no,status=no,left=0,top=0'); return false"><img src="https://www.worldpropertyjournal.com/assets_c/2026/05/San%20Francisco%20Luxury%20Housing%20Market%20Prices%20Chart%20%282026%29-thumb-1280x528-36661.png" style="width: 100%;" alt="San Francisco Luxury Housing Market Prices Chart (2026).png" class="mt-image-none" loading="lazy" decoding="async" /></a></div>
<p></p>
<p></p>]]>
    </content>
</entry>

<entry>
    <title>Ireland&apos;s Housing Boom Cools as Urban Markets Stabilize, Shortages Persist</title>
    <link rel="alternate" type="text/html" href="https://www.worldpropertyjournal.com/real-estate-news/ireland/dublin/ireland-2026-home-sales-data-daftie-2026-ireland-housing-data-dublin-home-prices-in-2026-ronan-lyons-trinity-college-dublin-14741.php" />
    <id>tag:www.worldpropertyjournal.com,2026://1.14741</id>

    <published>2026-05-01T10:50:31Z</published>
    <updated>2026-05-01T09:55:11Z</updated>

    <summary>Ireland&apos;s once red-hot housing market is beginning to cool, with price growth easing to its slowest pace in more than two years as supply improves in major cities while shortages persist elsewhere.</summary>
    <author>
        <name>David Barley</name>
        
    </author>
    
        <category term="Cork" scheme="http://www.sixapart.com/ns/types#category" />
    
        <category term="Dublin" scheme="http://www.sixapart.com/ns/types#category" />
    
        <category term="Europe Residential News" scheme="http://www.sixapart.com/ns/types#category" />
    
        <category term="Galway" scheme="http://www.sixapart.com/ns/types#category" />
    
        <category term="Ireland" scheme="http://www.sixapart.com/ns/types#category" />
    
        <category term="Limerick" scheme="http://www.sixapart.com/ns/types#category" />
    
    
    <content type="html" xml:lang="en-us" xml:base="https://www.worldpropertyjournal.com/">
        <![CDATA[<p></p>
<p>Ireland's once red-hot housing market is beginning to cool, with price growth easing to its slowest pace in more than two years as supply improves in major cities while shortages persist elsewhere.</p>
<p>New data from Daft.ie shows national asking prices rose 3.7% in the year to March, marking the weakest annual increase since late 2023. The average listed price for a three-bedroom semi-detached home stood at €435,000 in the first quarter, leaving values about 42% above pre-pandemic levels and still modestly below their mid-2000s peak.</p>
<p>The moderation is also evident in closed sales. Transaction prices increased 5.6% year-on-year through March--also the slowest growth rate in over two years--while quarterly gains stalled, signaling a market losing momentum after a prolonged run-up. The gap between asking and final sale prices, a key measure of competition, narrowed to 5.8%, indicating less aggressive bidding conditions.</p>
<p>The shift, however, is far from uniform. A pronounced urban-rural divide is emerging, with stabilization taking hold first in cities where supply has begun to recover.</p>
<p>In Dublin, asking prices rose just 2.5% from a year earlier, and transaction prices edged lower in the first quarter. Other major urban centers saw even more subdued growth, with list prices up just 0.7%. Increased availability--particularly in the second-hand market--is easing pressure on buyers and tempering price gains.</p>
<p>Outside the cities, the picture remains markedly different. Prices continue to climb at a faster clip, rising roughly 5% in Leinster and more than 8% in Connacht-Ulster, where limited housing stock continues to fuel competition.</p>
<p>Supply remains the central fault line. Just over 10,100 second-hand homes were on the market nationwide at the start of March, up 6% from a year earlier but still less than half the typical pre-pandemic level. While inventory in Dublin has rebounded closer to historical norms, shortages remain acute across much of the country.</p>
<p>The result is what economists increasingly describe as a "two-speed" housing market: cooling conditions in urban hubs contrasted with persistent inflation in supply-constrained regions.</p>
<p>"Price growth is clearly slowing, but the adjustment is uneven," said Ronan Lyons, an economist at Trinity College Dublin and author of the report. "Improving availability in cities is easing competition, particularly in Dublin, but outside those areas supply remains far below normal levels, sustaining upward pressure on prices."</p>
<p>That imbalance underscores a deeper structural issue. Despite modest gains in listings, Ireland continues to face a significant housing shortfall. Analysts estimate that construction levels would need to roughly double across private, rental and social housing segments to restore long-term equilibrium.</p>
<p>For now, the data suggest the market is transitioning rather than turning--shifting from broad-based price acceleration to a more selective, supply-driven landscape where geography increasingly determines outcomes.</p>
<p></p>
<div class="assets"><a href="https://www.worldpropertyjournal.com/assets_c/2026/05/Ireland%20National%20Home%20Price%20Data%20%282026%29-36655.php" data-test="popup-now" onclick="window.open('https://www.worldpropertyjournal.com/assets_c/2026/05/Ireland%20National%20Home%20Price%20Data%20%282026%29-36655.php','popup','width=1197,height=692,scrollbars=yes,resizable=no,toolbar=no,directories=no,location=no,menubar=no,status=no,left=0,top=0'); return false"><img src="https://www.worldpropertyjournal.com/assets_c/2026/05/Ireland%20National%20Home%20Price%20Data%20%282026%29-thumb-1000xauto-36655.png" style="width: 100%;" alt="Ireland National Home Price Data (2026).png" class="mt-image-none" loading="lazy" decoding="async" /></a></div>
<p></p>]]>
    </content>
</entry>

<entry>
    <title>Asia-Pacific Commercial Property Rebounds as Investors Return in 2026</title>
    <link rel="alternate" type="text/html" href="https://www.worldpropertyjournal.com/real-estate-news/australia/sydney-real-estate-news/asia-pacific-commercial-investment-data-for-2026-top-commercial-investment-markets-in-2026-cbre-2026-asia-pacific-property-investment-report-14739.php" />
    <id>tag:www.worldpropertyjournal.com,2026://1.14739</id>

    <published>2026-04-30T11:42:23Z</published>
    <updated>2026-04-30T10:24:01Z</updated>

    <summary>Asia-Pacific real estate is staging a cautious comeback, with investors signaling a renewed appetite for commercial property acquisitions in 2026 as market conditions stabilize and income visibility improves.</summary>
    <author>
        <name>Michael Gerrity</name>
        
    </author>
    
        <category term="Asia Pacific Commercial News" scheme="http://www.sixapart.com/ns/types#category" />
    
        <category term="Australia" scheme="http://www.sixapart.com/ns/types#category" />
    
        <category term="Sydney" scheme="http://www.sixapart.com/ns/types#category" />
    
    
    <content type="html" xml:lang="en-us" xml:base="https://www.worldpropertyjournal.com/">
        <![CDATA[<p></p>
<p>Asia-Pacific real estate is staging a cautious comeback, with investors signaling a renewed appetite for commercial property acquisitions in 2026 as market conditions stabilize and income visibility improves.</p>
<p>A new survey from CBRE Group shows 57% of regional investors intend to expand their property holdings this year, reflecting a steady shift away from the defensive strategies that dominated the past two years. Net buying intentions--a closely watched gauge of sentiment--rose to 17%, continuing a multi-year climb from 13% in 2025 and just 5% in 2024.</p>
<p>The improving outlook is being underpinned by a combination of firmer occupier demand, a thinning development pipeline and gradually loosening financing conditions. Together, those factors are prompting investors to re-enter the market with a sharper focus on assets capable of delivering durable rental growth.</p>
<p>Office properties have emerged as the leading target for capital deployment for the first time in six years, overtaking industrial and logistics assets that had dominated allocations during the pandemic-era e-commerce boom. The resurgence is most pronounced in gateway markets such as Tokyo, Sydney and Singapore, where high occupancy levels and limited new supply are supporting rent growth and stabilizing valuations.</p>
<p>Cross-border capital continues to gravitate toward Tokyo, which retains its position as the region's most favored investment destination for a seventh consecutive year. Investors are drawn by relatively low borrowing costs and consistent income streams. Sydney ranks next, followed by Singapore and Seoul, while Hong Kong has re-entered the top tier amid a pickup in activity tied to residential conversions and hotel repositioning.</p>
<p>While offices lead, industrial and logistics assets remain firmly in focus, with roughly one-fifth of investors prioritizing the sector amid expectations that new supply will taper off after 2027. Structural demand linked to e-commerce continues to provide long-term support. Meanwhile, rental housing--particularly build-to-rent--has gained traction, alongside rising institutional interest in data centers as digital infrastructure becomes increasingly embedded in portfolio strategies.</p>
<p>Investment approaches are also evolving. Core-plus and value-add strategies now dominate, accounting for more than 60% of investor preferences, as buyers position for rental-driven upside rather than relying on distressed pricing. Opportunistic plays have lost favor, reflecting a decline in forced sales and persistently high construction and labor costs.</p>
<p>Real estate investment trusts across Asia-Pacific are expected to be among the most active buyers this year, while private investors may begin trimming holdings acquired during earlier market dislocations.</p>
<p>Despite the improving tone, risks remain. Investors cite rising construction and labor expenses as the most significant headwind, overtaking interest rates for the first time. Geopolitical uncertainty continues to weigh on sentiment in key markets such as China and India, while shifting central bank signals in Japan and Australia have reintroduced concerns about the path of borrowing costs.</p>
<p>Even so, the broader trajectory points toward a measured recovery--one defined less by exuberance and more by disciplined capital deployment into high-quality assets with clear, income-generating potential.</p>
<p></p>
<div class="assets"><a href="https://www.worldpropertyjournal.com/assets_c/2026/04/Asia%20Pacific%202026%20CRE%20Investment%20Themes%20%28By%20CBRE%29-36651.php" data-test="popup-now" onclick="window.open('https://www.worldpropertyjournal.com/assets_c/2026/04/Asia%20Pacific%202026%20CRE%20Investment%20Themes%20%28By%20CBRE%29-36651.php','popup','width=998,height=783,scrollbars=yes,resizable=no,toolbar=no,directories=no,location=no,menubar=no,status=no,left=0,top=0'); return false"><img src="https://www.worldpropertyjournal.com/assets_c/2026/04/Asia%20Pacific%202026%20CRE%20Investment%20Themes%20%28By%20CBRE%29-thumb-998x782-36651.png" style="width: 100%;" alt="Asia Pacific 2026 CRE Investment Themes (By CBRE).png" class="mt-image-none" loading="lazy" decoding="async" /></a></div>
<p></p>]]>
    </content>
</entry>

<entry>
    <title>Planning a Home Renovation? Don&apos;t Overlook Your Cooling System</title>
    <link rel="alternate" type="text/html" href="https://www.worldpropertyjournal.com/sponsored-news/planning-a-home-renovation-dont-overlook-your-cooling-system-14740.php" />
    <id>tag:www.worldpropertyjournal.com,2026://1.14740</id>

    <published>2026-04-30T10:48:12Z</published>
    <updated>2026-04-30T09:56:35Z</updated>

    <summary>Whether you are knocking down a wall to create an open-concept kitchen, finishing a basement for extra living space, or adding a second story to accommodate a growing family, the focus tends to land on the visible upgrades -- new flooring, modern fixtures, fresh paint.</summary>
    <author>
        <name>Author</name>
        
    </author>
    
        <category term="Press Releases" scheme="http://www.sixapart.com/ns/types#category" />
    
        <category term="Sponsored News" scheme="http://www.sixapart.com/ns/types#category" />
    
    
    <content type="html" xml:lang="en-us" xml:base="https://www.worldpropertyjournal.com/">
        <![CDATA[<p></p>
<p>Home renovations are exciting. Whether you are knocking down a wall to create an open-concept kitchen, finishing a basement for extra living space, or adding a second story to accommodate a growing family, the focus tends to land on the visible upgrades -- new flooring, modern fixtures, fresh paint. But behind every beautiful renovation lies a network of mechanical systems that need to keep up with the changes, and the one that homeowners most frequently overlook is the air conditioning. Expanding your living space, altering the layout of rooms, or improving insulation all change the way cool air moves through your home, and failing to account for that can leave you with hot spots, humidity issues, and energy bills that erase the value of your investment.</p>
<p>The reason this happens so often is simple: most renovation budgets are built around cosmetic and structural work, with HVAC considerations treated as an afterthought. Homeowners assume that their existing cooling system will handle the new space just as well as it handled the old one. In practice, that assumption rarely holds up. A system that was originally sized for a 1,600-square-foot layout will struggle to cool 2,100 square feet after a room addition. Open floor plans change airflow dynamics. New windows alter heat gain patterns. All of these factors mean that a renovation is often the ideal moment to evaluate whether you need a new <a href="https://regionserviceco.com/services/hvac-contractor-bensalem-pa/ac-installation/" target="_blank" rel="noopener">AC installation</a> -- not as an extra expense, but as an integral part of the project that protects the comfort and efficiency of your newly redesigned home.</p>
<p>Bringing your HVAC contractor into the conversation early -- ideally during the planning phase rather than after construction has begun -- allows the cooling system design to be coordinated with the rest of the renovation. Ductwork can be routed through new walls before drywall goes up. Electrical capacity can be allocated for a higher-efficiency unit. Equipment placement can be optimized for performance and aesthetics rather than squeezed into whatever space is left over. This kind of coordination saves time, reduces costs, and produces a far better result than retrofitting a cooling solution after the fact.</p>
<h3 class="sub-title">How Renovations Change Your Cooling Needs</h3>
<p>Every modification to a home's structure affects its thermal characteristics. Adding square footage is the most obvious change -- more space simply requires more cooling capacity. But even renovations that do not increase the overall footprint can have a significant impact. Removing interior walls, for example, creates larger open volumes that change the way air circulates. A room that previously stayed cool with a single supply vent may now need additional airflow to compensate for the open connection to adjacent spaces.</p>
<p>Window upgrades are another factor that works in both directions. Installing larger windows or adding a sunroom increases solar heat gain, which raises the cooling load. On the other hand, replacing old single-pane windows with modern double- or triple-pane units with low-E coatings can dramatically reduce heat transfer, potentially allowing you to install a smaller, more efficient system than your current one. The point is that each change matters, and the only way to know the net effect is to have a professional reassess the cooling load after the renovation scope is finalized.</p>
<p>Insulation improvements tell a similar story. Many homeowners take the opportunity during a renovation to upgrade insulation in walls, attics, and crawl spaces. This is an excellent investment, but it also changes the equation. A well-insulated home retains conditioned air more effectively, which means the cooling system does not need to work as hard. Installing a new unit that accounts for this improved envelope ensures that you are not paying for more capacity than you actually need -- and that the system runs at optimal efficiency rather than short-cycling due to oversizing.</p>
<h3 class="sub-title">Ductwork: The Hidden Bottleneck</h3>
<p>Even homeowners who recognize the need for a new air conditioning unit during a renovation often underestimate the importance of the ductwork that delivers cooled air to every room. Existing duct systems in older homes are frequently undersized, poorly sealed, or routed inefficiently. Studies from the U.S. Department of Energy suggest that the average home loses 20 to 30 percent of its conditioned air through leaks and gaps in the duct network -- meaning that a significant portion of the energy you pay for never actually reaches the rooms you are trying to cool.</p>
<p>A renovation provides a rare opportunity to address these issues. While walls are open and ceilings are accessible, a contractor can replace aging ductwork, resize runs to match new room configurations, seal all connections, and add insulation around ducts that pass through unconditioned spaces like attics and crawl areas. Pairing a new high-efficiency air conditioning unit with a properly designed and sealed duct system delivers the full benefit of the equipment's performance rating -- something that is nearly impossible to achieve when new equipment is connected to old, leaking ducts.</p>
<h3 class="sub-title">Zoning: A Smart Addition for Renovated Homes</h3>
<p>If your renovation creates distinct living zones -- a finished basement used primarily in the evenings, a home office occupied during business hours, or a master suite on a separate floor -- a zoned cooling system is worth serious consideration. Zoning uses motorized dampers within the ductwork and multiple thermostats to direct cooled air only to the areas that need it at any given time. The result is greater comfort, reduced energy waste, and the ability to set different temperatures in different parts of the home based on usage patterns.</p>
<p>For homes where running ductwork to a new addition is impractical, ductless mini-split systems offer an efficient alternative. These units consist of a small outdoor compressor connected to one or more wall-mounted indoor air handlers, each controlled independently. They are ideal for sunrooms, converted garages, attic bedrooms, and other spaces that fall outside the reach of the existing central system. Many homeowners find that a combination of a central ducted system and one or two ductless units provides the most flexible and cost-effective solution for a renovated home.</p>
<h3 class="sub-title">Timing and Budget Considerations</h3>
<p>One of the biggest advantages of coordinating an AC installation with a renovation is cost efficiency. Labor, materials, and equipment access are already on site, which reduces the overhead of scheduling a separate project later. Ductwork modifications that would require opening finished walls and ceilings after a renovation is complete -- adding thousands of dollars in repair costs -- can be done at a fraction of that expense while the space is still under construction. Additionally, many utility companies and manufacturers offer rebates on high-efficiency equipment, and some of these incentives can be combined with energy-efficiency tax credits to further offset the investment.</p>
<h3 class="sub-title">Conclusion</h3>
<p>A renovation is the perfect time to take a hard look at your cooling system. The structural changes you are making will inevitably shift your home's comfort needs, and addressing those changes proactively -- with the right equipment, properly sized ductwork, and a thoughtful installation plan -- ensures that your renovated space feels as good as it looks.</p>
<p>Involve your HVAC contractor early, invest in a system that matches your updated home, and treat your cooling infrastructure as a core part of the renovation rather than an afterthought. The payoff is a home that stays comfortable, efficient, and ready for whatever the next summer brings.</p>]]>
    </content>
</entry>

<entry>
    <title>The New Drivers of Home Value in Modern Real Estate</title>
    <link rel="alternate" type="text/html" href="https://www.worldpropertyjournal.com/sponsored-news/the-new-drivers-of-home-value-in-modern-real-estate-14738.php" />
    <id>tag:www.worldpropertyjournal.com,2026://1.14738</id>

    <published>2026-04-29T16:58:14Z</published>
    <updated>2026-04-29T16:14:18Z</updated>

    <summary>The modern real estate market has evolved beyond traditional, simple valuation drivers like square footage and comparable sales.</summary>
    <author>
        <name>Author</name>
        
    </author>
    
        <category term="Press Releases" scheme="http://www.sixapart.com/ns/types#category" />
    
        <category term="Sponsored News" scheme="http://www.sixapart.com/ns/types#category" />
    
    
    <content type="html" xml:lang="en-us" xml:base="https://www.worldpropertyjournal.com/">
        <![CDATA[<p></p>
<p>The modern real estate market has evolved beyond traditional, simple valuation drivers like square footage and comparable sales. Increasingly, buyers prioritize operational efficiency, sustainability, and technology integration alongside square footage and good locations. </p>
<p>A National Association of Realtors (NAR) study suggests that just under two-thirds (63%) of real estate professionals consider energy efficiency an important factor in listings; the same holds for other metrics, such as water efficiency. Here, we'll discuss traditional drivers such as location and neighborhood quality, as well as more modern priorities like sustainability, technology integration, and water and energy efficiency.</p>
<p><strong>Location and Neighborhood Quality</strong></p>
<p>Location and neighborhood quality are still essential drivers of property valuation, but what makes a location "good" is different today than it was in the past. Increasingly, buyers are much more data-driven in their assessments. Today's buyer can assess crime rates, school quality, access to amenities, and environmental risk through fairly simple online searching. Some research suggests that almost 40% of buyers used virtual reality (VR) tools to evaluate homes and neighborhoods in 2025, compared with just 22% in 2022.</p>
<p>As a result, real estate professionals and the market have had to adapt to new conditions. While location and neighborhood quality's roles as the main drivers of value remain intact, the way these valuations are made and the factors that impact suitability for buyers have changed to meet thoroughly modern needs and priorities.</p>
<p><strong>Property Features and Home Improvements</strong></p>
<p>Today's buyer increasingly prioritizes features that weren't previously important - a big example is the availability of suitable office space. Post-pandemic trends have allowed many professionals to trade the office for home working, at least part of the time - according to Gallup data, in professions where flexible or off-site working is possible, 52% of roles are hybrid with a further 26% being exclusively remote. As a result, 38% of buyers in 2025 prioritized home office space, up from 28% in 2023.</p>
<p>Other amenities and home improvements have proven important with buyers, including gardens and private yard space - 42% of recent buyers value outdoor space - while in 2025, 33% of buyers wanted smart security or other automation features. </p>
<p>While property features and amenities have always been important considerations for buyers, the specific features desired by modern buyers are driving broad changes in which properties meet those criteria.</p>
<p><strong>Sustainability and Energy Efficiency</strong></p>
<p>A major modern driver of value is sustainability and energy efficiency, with energy-efficient homes commanding a considerable premium - typically 3-5% higher, according to Freddie Mac data. A HomeLight survey of more than 900 real estate agents in 2022 found that homes with better energy efficiency saw an added value of around $8,000 compared to those with worse efficiency ratings. This aligns with NAR's findings that 90% of homebuyers are willing to pay more for homes with energy-saving features.</p>
<p>Sustainability and energy efficiency command a premium because sustainability represents significant ongoing operational savings, greatly improving the affordability and desirability of efficient homes. Research by the Department of Energy reports that efficient home energy management systems can deliver energy savings up to 35%, with utility bill reductions up to a massive 29%. Against the backdrop of rising bills, many prospective homeowners opt for higher initial purchase prices with lower monthly operational costs, thereby increasing overall property value.</p>
<p><strong>Technology and Smart Homes</strong></p>
<p>Parks Associates research estimates that 42% of US households with Internet access own at least one smart home device. Popular smart devices include thermostats, lighting systems, security devices, and entertainment systems like smart speakers. A Security.org survey found that 56% of respondents already owned security-related smart devices, while 90% of those without such devices expressed a desire to own one in the future. </p>
<p>The rapid rise of smart home technology has shifted homebuyers' priorities significantly in recent years, with research showing that 78% of buyers are willing to pay more for a home with smart devices. As a result, these devices don't simply provide functionality; a recent NAR report suggests smart home devices can increase a property's resale value by up to 5%.</p>
<p><strong>Water Submetering and Utility Cost Transparency</strong></p>
<p>Rising water costs mean buyers, especially in drought-prone regions, are increasingly considering the total cost of ownership, including utilities, when they are looking to purchase a new home. Water submetering has emerged as a key consideration, allowing unprecedented transparency and control over water consumption.</p>
<p>The benefits of water submetering to property owners, homeowners, and prospective buyers are enormous: multiple sources, including the Environmental Protection Agency and the US DoE, suggest submetering can lower water consumption from 15% to 30% and significantly reduce ongoing operating costs. </p>
<p>The EPA estimates that household leaks waste more than 1 trillion gallons of water annually; EPA research also positions smart water submeters as effective at identifying such leaks early, preventing spiralling costs. A case study from water submetering provider <a href="https://mainlink.net/" target="_blank" rel="noopener">Mainlink</a> showed that one California community unlocked $17,000 in monthly savings after adopting a modern water submetering system, representing a significant decrease in utility spending. </p>
<p>Accurate billing, efficiency, and transparency increase perceived and actual affordability of properties, even at higher purchase prices.</p>
<p><strong>Shifting Priorities</strong></p>
<p>Factors influencing property valuations today are increasingly shifting from static attributes, such as square footage, towards performance-driven factors, including energy efficiency, smart technology integration, and cost transparency. Market evidence shows buyers will pay a premium for homes that reduce costs, improve convenience, and integrate data, sustainability, and technology, driving new trends in property valuation.</p>
<p></p>]]>
    </content>
</entry>

<entry>
    <title>Global Luxury Home Prices Climb for Second Straight Year in 2025</title>
    <link rel="alternate" type="text/html" href="https://www.worldpropertyjournal.com/real-estate-news/japan/tokyo-real-estate-news/global-luxury-home-prices-in-2025-luxury-home-sales-data-for-2025-global-luxury-residential-prices-in-2025-prime-international-residential-index-piri--14737.php" />
    <id>tag:www.worldpropertyjournal.com,2026://1.14737</id>

    <published>2026-04-29T10:49:02Z</published>
    <updated>2026-04-29T09:53:50Z</updated>

    <summary>Global luxury residential prices extended their gains through 2025, outperforming mainstream housing markets for the second consecutive year as resilient demand from wealthy buyers supported key cities worldwide.</summary>
    <author>
        <name>Michael Gerrity</name>
        
    </author>
    
        <category term="Asia Pacific Residential News" scheme="http://www.sixapart.com/ns/types#category" />
    
        <category term="Dubai" scheme="http://www.sixapart.com/ns/types#category" />
    
        <category term="Japan" scheme="http://www.sixapart.com/ns/types#category" />
    
        <category term="London" scheme="http://www.sixapart.com/ns/types#category" />
    
        <category term="Miami" scheme="http://www.sixapart.com/ns/types#category" />
    
        <category term="Monaco" scheme="http://www.sixapart.com/ns/types#category" />
    
        <category term="New York City" scheme="http://www.sixapart.com/ns/types#category" />
    
        <category term="Singapore" scheme="http://www.sixapart.com/ns/types#category" />
    
        <category term="Tokyo" scheme="http://www.sixapart.com/ns/types#category" />
    
        <category term="United Arab Emirates" scheme="http://www.sixapart.com/ns/types#category" />
    
        <category term="United Kingdom" scheme="http://www.sixapart.com/ns/types#category" />
    
    
    <content type="html" xml:lang="en-us" xml:base="https://www.worldpropertyjournal.com/">
        <![CDATA[<p></p>
<h3 class="sub-title">Tokyo is Global Leader with 58 Percent Luxury Price Surge, Followed by Dubai</h3>
<p></p>
<p>Global luxury residential prices extended their gains through 2025, outperforming mainstream housing markets for the second consecutive year as resilient demand from wealthy buyers supported key cities worldwide.</p>
<p>The Prime International Residential Index, or PIRI 100, which tracks 100 high-end markets compiled by London-based consultancy Knight Frank, rose an average 3.2% last year, according to the firm's 20th annual Wealth Report. Prices advanced in 73 of the 100 locations, underscoring broad but uneven strength at the upper end of the market.</p>
<p>Tokyo led the way with a striking 58.5% surge in prime new-build apartment values, propelled by chronic supply constraints and robust demand. Dubai posted a 25.1% increase and retained its status as the world's most active market for homes priced above $10 million, recording roughly 500 such transactions during the year.</p>
<p>Regionally, the Middle East delivered the strongest performance with a 9.4% rise, followed by Latin America and the Caribbean at 4.7%. Asia-Pacific advanced 3.6% and Europe gained 3.3%. North America was the outlier, slipping 0.9% amid weakness in Canada.</p>
<div class="assets">
<div class="caption text-right"><img style="margin-top: 6px; margin-bottom: 10px;" src="https://www.worldpropertyjournal.com/assets_c/2011/12/Liam-Bailey-thumb-200x279-14464.jpg" alt="Thumbnail image for Liam-Bailey.jpg" />
<div>Liam Bailey</div>
</div>
</div>
<p>Liam Bailey, editor of The Wealth Report comments, "In many markets, prime residential property has pulled away from the broader housing sector, underpinned by the strength of wealth creation. While mainstream markets remain exposed to wider economic pressures, the pace at which wealth is being generated is helping to keep demand for luxury property more resilient, even against recent volatility in debt costs."</p>
<p>A persistent shortage of high-quality, move-in-ready properties continued to underpin price premiums in the luxury segment. Affluent buyers are showing a clear preference for turnkey homes to sidestep construction delays and escalating renovation costs.</p>
<p>Shifting lifestyles among the ultra-wealthy are also reshaping demand. An increasing number of ultra-high-net-worth individuals are spending fewer than 90 days a year in traditional financial centers, boosting interest in luxury rental properties across multiple global destinations.</p>
<p>"UHNWIs are increasingly organising their lives across multiple jurisdictions, with family offices actively managing tax, lifestyle and political risk. As a result, established hubs such as London are shifting towards a 'dip-in, dip-out' model: places to spend time for business, culture and connectivity rather than permanent residence."</p>
<p>Looking forward, several markets appear poised for continued strength. Mumbai is projected to lead near-term gains with expected price growth of 8.7%, while Brisbane is gaining traction as a rising luxury hub. Miami has already seen prime prices climb roughly 67% over the past five years, and Hong Kong is displaying early signs of a rebound in its super-prime segment.</p>
<p>The data highlight a luxury housing market increasingly driven by cross-border capital flows, constrained supply, and more flexible living patterns among the world's wealthiest buyers.</p>
<p></p>]]>
    </content>
</entry>

</feed>