The WPJ
Residential Real Estate News
Case-Shiller National Home Price Index Reports Slowest Annual Rise Since 2012
Based on S&P CoreLogic Case-Shiller's National Home Price Index for December 2019, U.S. home price growth slowed considerably throughout most of 2019, with some pick-up in price in growth toward the end of the year.
When asked what this index research means for the U.S. housing market, Dr. Frank Nothaft, chief economist for CoreLogic said, "The drop in mortgage rates during the past week has improved payment affordability and will bring prospective buyers into the market. If rates stay low into the spring, we expect sales volume to be the highest in 13 years, and annual home price growth to quicken."
The decline in mortgage rates during 2019 has heightened demand for home purchase, and with rates even lower during the first two months of 2020, home price growth is expected to quicken in 2020. If mortgage rates remain low into the spring, the country could have the strongest first-half home sales volume in 13 years.
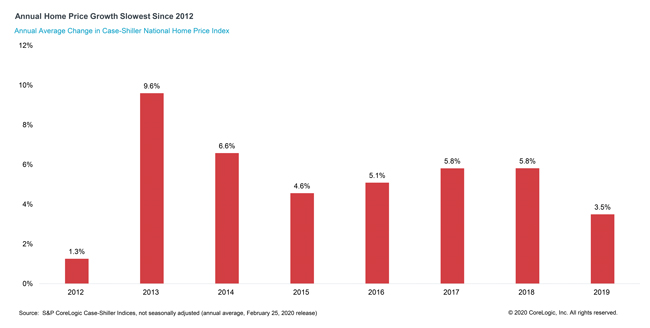
The latest S&P CoreLogic Case-Shiller National and Composite indexes record price movements through December and provide a complete view of price change throughout 2019. For the year as a whole, the annual average price growth was 3.5%, the slowest annual gain since 2012. While the 12-month change declined each month through August, during the final months of 2019 the annual change gradually picked up. The rising annual growth rate is expected to continue into 2020 with prices up better than 4% during 2020 in the U.S. index.
To contrast home-value appreciation with a broad inflation metric, we can compare the U.S. Case-Shiller index with the Bureau of Economic Analysis' Personal Consumption Expenditures (PCE) index. The PCE was up 1.4% during 2019 (annual average). The National Association for Business Economics reported that its latest Outlook Survey revealed that industry economists expect inflation (as measured by the PCE index) to be 1.9% in 2020, (measuring year over year from the fourth quarter of 2019). This is less than half the expected appreciation in home values. Thus, home price growth is projected to continue to outpace inflation.
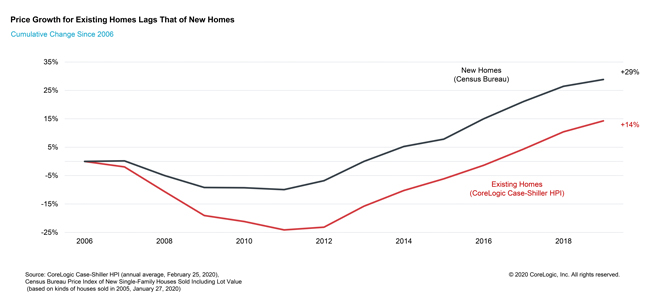
By price tier, homes that sold in the lower one-third of the price distribution increased in value by more than more expensive homes. Because new home construction generally adds more for-sale inventory at the upper end of the price distribution, new home sales have helped to moderate price growth for higher-priced homes. During each of the last four years, growth in existing home values as measured by the national Case-Shiller index has exceeded that of newly built homes. For instance, in 2019 the Census Bureau's new-home price index was up 1.9% (annual average) relative to 2018, compared with the 3.5% growth for existing home values found in the Case-Shiller. Even so, new home prices are up more than existing home prices since 2006, 29% versus 14%, respectively.
For the 20 urban markets covered by the S&P CoreLogic Case-Shiller Indexes, Phoenix topped the list in price growth (6.5%, December-to-December), followed by Charlotte, North Carolina (5.3%) and Tampa, Florida (5.2%). These markets have had strong population growth fueling home purchases. Chicago and New York reported the smallest gain of the 20 metros (1% for each). The Census Bureau reported Illinois and New York had an annual decline in population between 2018 and 2019.
When asked what this index research means for the U.S. housing market, Dr. Frank Nothaft, chief economist for CoreLogic said, "The drop in mortgage rates during the past week has improved payment affordability and will bring prospective buyers into the market. If rates stay low into the spring, we expect sales volume to be the highest in 13 years, and annual home price growth to quicken."
The decline in mortgage rates during 2019 has heightened demand for home purchase, and with rates even lower during the first two months of 2020, home price growth is expected to quicken in 2020. If mortgage rates remain low into the spring, the country could have the strongest first-half home sales volume in 13 years.
The latest S&P CoreLogic Case-Shiller National and Composite indexes record price movements through December and provide a complete view of price change throughout 2019. For the year as a whole, the annual average price growth was 3.5%, the slowest annual gain since 2012. While the 12-month change declined each month through August, during the final months of 2019 the annual change gradually picked up. The rising annual growth rate is expected to continue into 2020 with prices up better than 4% during 2020 in the U.S. index.
To contrast home-value appreciation with a broad inflation metric, we can compare the U.S. Case-Shiller index with the Bureau of Economic Analysis' Personal Consumption Expenditures (PCE) index. The PCE was up 1.4% during 2019 (annual average). The National Association for Business Economics reported that its latest Outlook Survey revealed that industry economists expect inflation (as measured by the PCE index) to be 1.9% in 2020, (measuring year over year from the fourth quarter of 2019). This is less than half the expected appreciation in home values. Thus, home price growth is projected to continue to outpace inflation.
By price tier, homes that sold in the lower one-third of the price distribution increased in value by more than more expensive homes. Because new home construction generally adds more for-sale inventory at the upper end of the price distribution, new home sales have helped to moderate price growth for higher-priced homes. During each of the last four years, growth in existing home values as measured by the national Case-Shiller index has exceeded that of newly built homes. For instance, in 2019 the Census Bureau's new-home price index was up 1.9% (annual average) relative to 2018, compared with the 3.5% growth for existing home values found in the Case-Shiller. Even so, new home prices are up more than existing home prices since 2006, 29% versus 14%, respectively.
For the 20 urban markets covered by the S&P CoreLogic Case-Shiller Indexes, Phoenix topped the list in price growth (6.5%, December-to-December), followed by Charlotte, North Carolina (5.3%) and Tampa, Florida (5.2%). These markets have had strong population growth fueling home purchases. Chicago and New York reported the smallest gain of the 20 metros (1% for each). The Census Bureau reported Illinois and New York had an annual decline in population between 2018 and 2019.
Real Estate Listings Showcase


This website uses cookies to improve user experience. By using our website you consent in accordance with our Cookie Policy. Read More