The WPJ
Residential Real Estate News


Over 25% of Working U.S. Households Spend 50% of Monthly Income on Housing Cost
According to a new study by the Center for Housing Policy now confirms that falling home prices have not solved the housing affordability problems of the nation's working households.
In fact, the Center's Housing Landscape 2012 report found that the share of working households paying more than half their income for housing rose significantly between 2008 and 2010 for both renters and owners. This annual report explores the latest Census data from 2008 to 2010 on housing costs and income, including housing cost burden data from the 50 largest U.S. metropolitan areas, all 50 states and the District of Columbia. Among other conclusions, Housing Landscape 2012 finds that nearly one in four working households in the U.S. spends more than half of total income on housing.
Housing cost burden for working households grew over the two-year period studied largely due to falling incomes and rising rental housing costs. Report author Laura Williams says rents rose due to increased demand for rental housing which has outstripped supply, partly due to the crisis on the homeownership side of the market.
"More and more people are interested in renting," Williams remarked. "Some prefer it because it allows them to be more mobile in a tough job market. Others are postponing purchasing a home or facing difficulties obtaining a mortgage. Given the long lead times involved in responding to increased demand with increased supply, the rental market has tightened somewhat and rents increased."
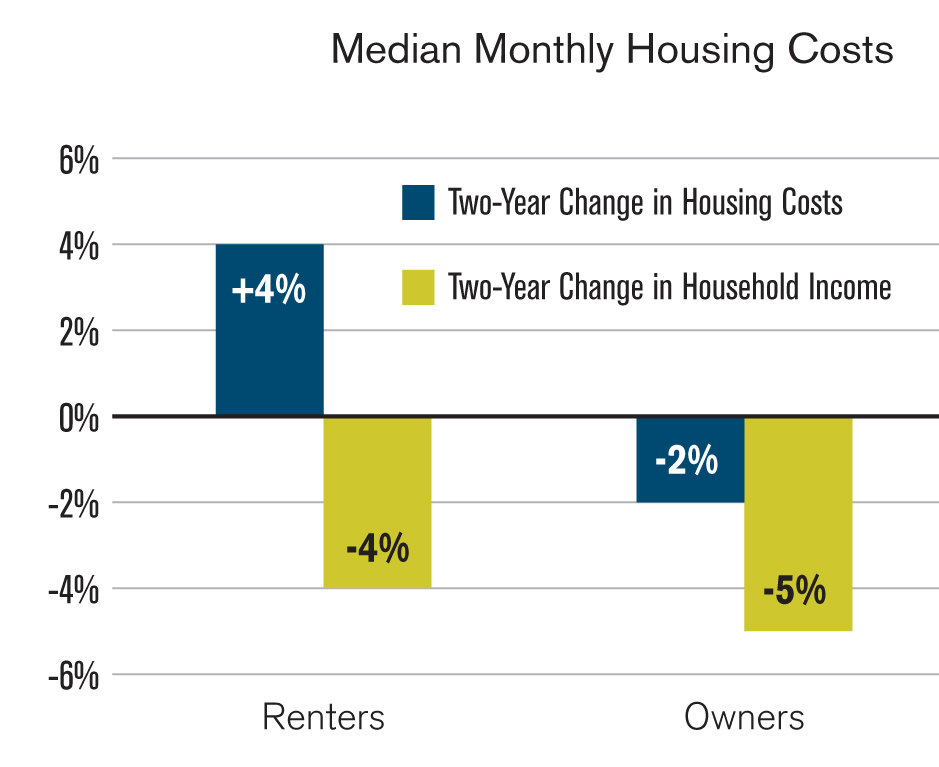
For working homeowners over the same two-year period, incomes slid more than twice as much as housing costs. In fact, incomes for working homeowners fell even more sharply than they did for working renters. Jeffrey Lubell, executive director of the Washington-based Center for Housing Policy, said this phenomenon was primarily due to a drop in average hours worked among moderate-income homeowners.
"The data show that homeowners have been hit hard by the housing crisis in more ways than just lost equity," Lubell explained. "Many working homeowners have been laid off or had their hours cut."
Additionally, the housing costs of most working homeowners are still tied to homes bought before the sharp drop in home prices and thus do not reflect today's lower home purchase prices.
"Most of today's homeowners bought their homes at a time when housing prices were much higher than they are today," Lubell continued. "As a result, their housing costs have not declined nearly as much as you would expect from looking at the broader market declines in home sale prices."
Key National Findings
- Nearly one in four working households spends more than half of its income on housing. The share of working households with a severe housing cost burden increased significantly between 2008 and 2010, rising from 21.8 percent to 23.6 percent.
- Despite falling home prices and values, housing affordability worsened for working homeowners. Median housing costs for working homeowners declined modestly between 2008 and 2010. Meanwhile, the incomes of working homeowners declined even more, driven in large part by a decrease in the median number of hours worked per week between 2008 and 2010.
- Working renters fared even worse, with both increased rents and decreased incomes between 2008 and 2010. While incomes increased somewhat between 2009 and 2010, over the two-year period renters saw a four percent decline in household income. The housing costs of renters rose over the two-year period by four percent.
State and Local Findings
Between 2008 and 2010, the share of working households with a severe housing cost burden increased significantly in 24 states and decreased significantly in only one state: Maine. Eight other states that saw no significant increase in the percentage of such households already had steadily high rates of severe housing cost burden.
Among the 50 states and the District of Columbia, the following five had the highest share of working households with a severe housing cost burden in 2010:
- California 34%
- Florida 33%
- New Jersey 32%
- Hawaii 30%
- Nevada 29%
Among the 50 largest metropolitan areas, the following five metropolitan areas had the highest share of working households with a severe housing cost burden in 2010:
- Miami-Fort Lauderdale-Pompano Beach, FL 43%
- Los Angeles-Long Beach-Santa Ana, CA 38%
- San Diego-Carlsbad-San Marcos, CA 37%
- Riverside-San Bernardino-Ontario, CA 35%
- New York-Northern New Jersey-Long Island, NY-NJ-PA 35%
A closer look at the data reveals that the share of working households with a severe housing cost burden increased significantly over the two years studied in 19 of the 50 largest metropolitan areas, yet decreased significantly only in the Riverside, Calif., area. Of these 19 metro areas, 13 are located in the South and two more are in California. Overall, the level of severe housing cost burden among working households displayed a high level of variation at the metropolitan level. Levels ranged from a high of 43 percent in the Miami area to a low of 15 percent in Pittsburgh.
Real Estate Listings Showcase


This website uses cookies to improve user experience. By using our website you consent in accordance with our Cookie Policy. Read More