The WPJ
Residential Real Estate News


Home Flipping Slows in U.S., Investors Fear 'Flying too Close to the Sun'
According to RealtyTrac's U.S. Home Flipping Report for the first quarter of 2014, 3.7 percent of all U.S. single family home sales were flips -- where a home is purchased and subsequently sold again within six months -- in the first quarter of 2014, down from 4.1 percent in the fourth quarter of 2013 and down from 6.5 percent in the first quarter of 2013.
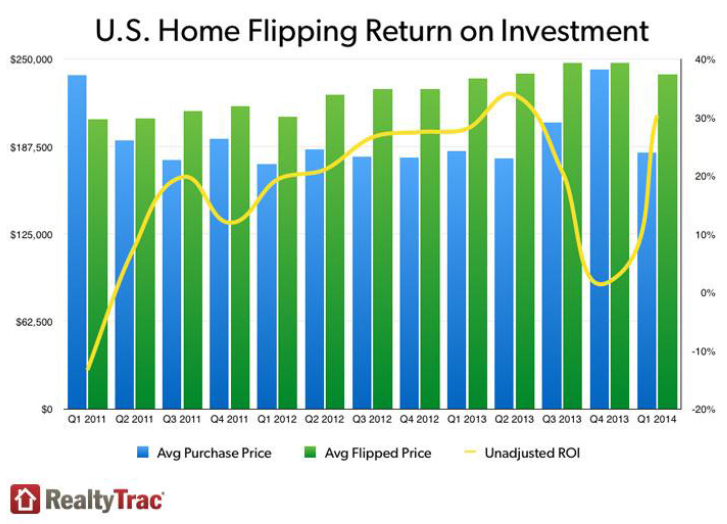
The average sales price of single family homes flipped in the first quarter was $55,574 higher than the average original purchase price. That gross profit provided flippers with an unadjusted ROI (return on investment) of 30 percent of the average original purchase price. The average gross profit per flip a year ago was $51,805 for an unadjusted ROI of 28 percent.
"Slowing home price appreciation early this year in many of the most popular flipping markets put some investors in danger of flying too close to the sun," said Daren Blomquist, vice president at RealtyTrac. "But investors appear to have recalibrated their flipping strategy, accounting for the slower home price appreciation even if that means fewer flips. This is another good sign that this housing recovery is behaving much more rationally than the last housing boom, which was built largely on unfounded speculation rather than fact-based calculations."
Other high-level findings in the report:
- Flips completed in the first quarter took an average of 101 days to complete, up from an average of 92 days in the previous quarter and up from an average of 79 days for flips completed in the first quarter of 2013.
- Among metro areas with a population of at least 1 million and at least 25 single family homes flipped in the first quarter, those with the highest share of flips in the first quarter were New York (10.2 percent), Jacksonville, Fla., (10.0 percent), San Diego (7.1 percent), Las Vegas (6.7 percent) and Miami (5.9 percent).
- Among metro areas with a population of at least 1 million and at least 25 single family homes flipped in the first quarter, those with the highest average gross ROI percentage on single family homes flipped in the first quarter were Pittsburgh (89 percent), Philadelphia (56 percent), Memphis (51 percent), Detroit (48 percent), and Seattle (48 percent).
- Among those same major metros, those with the biggest increase from a year ago in home flipping as a share of all sales were San Antonio (up 52 percent), Nashville (up 50 percent), Indianapolis (up 47 percent), Austin (up 35 percent), Providence, R.I. (up 33 percent), and Oklahoma City (up 33 percent).
- Other major markets with year-over-year increases in flipping as a share of all sales included Los Angeles (up 1 percent), Dallas (up 28 percent), Seattle (up 19 percent), Houston (up 29 percent), and Portland (up 2 percent).
- Among major metros, those with the biggest decrease from a year ago in home flipping as a share of all sales were New Orleans (down 83 percent), Baltimore (down 81 percent), Minneapolis (down 80 percent), Richmond, Va. (down 80 percent), Detroit (down 76 percent), and Washington, D.C. (down 73 percent).
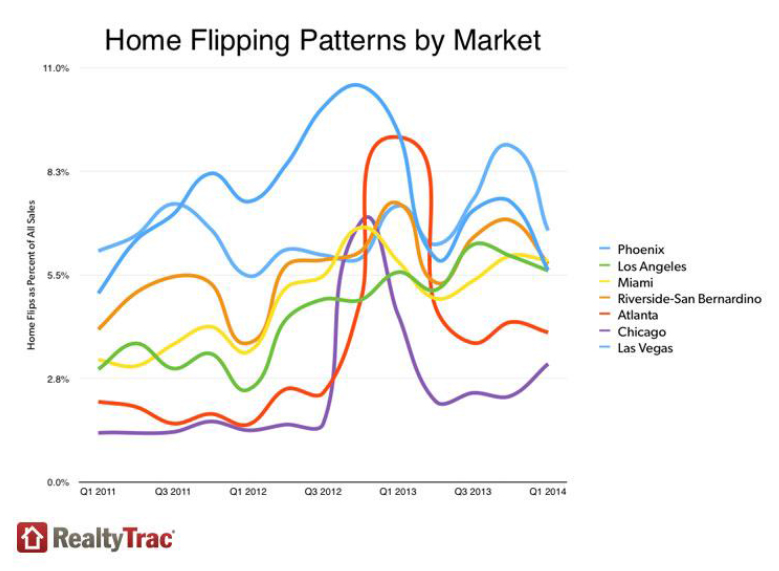
- Other major metros with year-over-year decreases in flipping as a share of all sales included New York (down 37 percent), Phoenix (down 39 percent), Riverside-San Bernardino in Southern California (down 22 percent), Atlanta (down 57 percent), Chicago (down 29 percent) and Las Vegas (down 9 percent).
- Among all metro areas nationwide those with the highest volume of flips in the first quarter were New York (1,791), Phoenix (894), Los Angeles (828), Miami (749), and Riverside-San Bernardino in Southern California (627).
- 82 percent of all properties flipped in the first quarter were sold to owner-occupants; 18 percent to buyers with a different mailing address than the property.
- 43 percent of all properties flipped in the first quarter were all-cash sales to the new buyer.
- 58 percent of all properties flipped in the first quarter were 3-bedroom homes, 21 percent 4 bedroom homes and 17 percent 2-bedroom homes.
- Flips that could be associated with building permits, outperformed the industry average. Unadjusted return-on-investment (ROI) was determined by looking solely at the purchase and sales prices for flipped properties. In the overall set, the median ROI was 13 percent compared to 50 percent across flips with at least one permit.
- The median expenditure on improvements for flips during the three-year time period was $4,800, representing 3.34 percent of the original purchase price of the property.
- Cities with the highest median improvement expenditures for flips were Atlanta ($18,250), Scottsdale, Ariz. ($14,772) and San Francisco ($13,900).
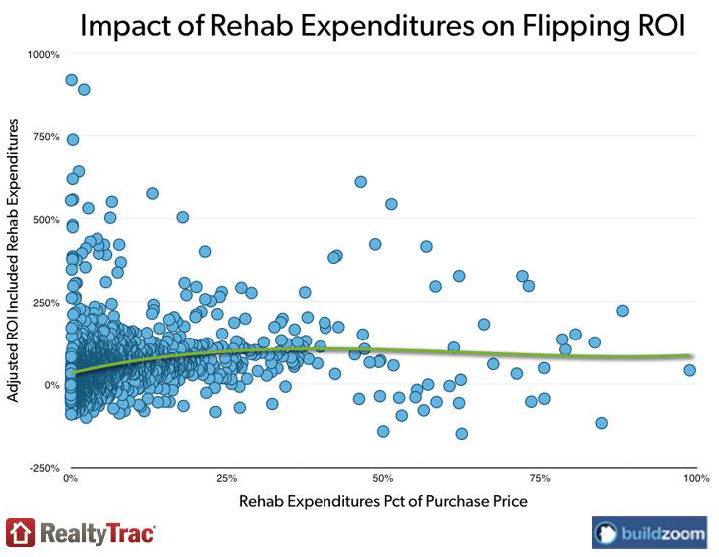
- Improvement expenditures were analyzed to measure their impact on adjusted ROI. The results indicate that increasing expenditures result in increasing ROI up to the point at which the expenditure represents around 23% of the original purchase price, at which point further expenditures result in diminishing returns.
- Flips were broken into quartiles, based on the size of the improvement expenditure. Investors in the top quartile (who spent the most) experienced the highest ROI whereas those in the bottom quartile experienced the lowest ROI.
- In San Francisco, ROI was analyzed based on the type of improvements performed. Kitchens, bathrooms and windows were all strong indicators of a high ROI.
Real Estate Listings Showcase


This website uses cookies to improve user experience. By using our website you consent in accordance with our Cookie Policy. Read More