The WPJ
Residential Real Estate News


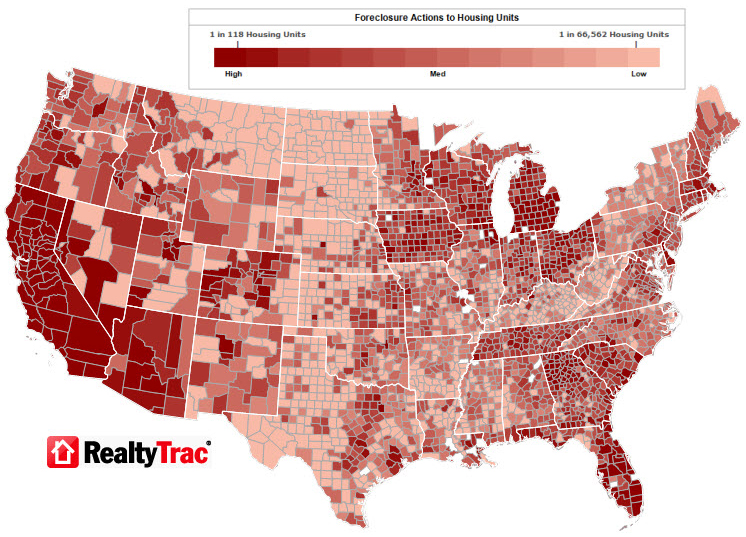
U.S. Foreclosure Filings Dip 34% in 2011 to 1.9 Million, Lowest levels Since 2007
Based on RealtyTrac's recently released Year-End 2011 U.S. Foreclosure Market Report, a total of 2,698,967 foreclosure filings - default notices, scheduled auctions and bank repossessions - were reported on 1,887,777 U.S. properties in 2011, a decrease of 34 percent in total properties from 2010. Foreclosure activity in 2011 was 33 percent below the 2009 total and 19 percent below the 2008 total.
RealtyTrac Report Highlights:
The report also shows that 1.45 percent of U.S. housing units (one in 69) had at least one foreclosure filing during the year, down from 2.23 percent in 2010, 2.21 percent in 2009, and 1.84 percent in 2008. Total U.S. foreclosure activity and the U.S. foreclosure rate in 2011 were both at their lowest annual level since 2007.- Average Days to Foreclose Up to 348 Nationwide
- Over 800 Days in NY, NJ and FL
- Annual Activity Down in 45 States
- Nevada, Arizona, California Post Highest Rates
"Foreclosures were in full delay mode in 2011, resulting in a dramatic drop in foreclosure activity for the year," said Brandon Moore, chief executive officer of RealtyTrac. "The lack of clarity regarding many of the documentation and legal issues plaguing the foreclosure industry means that we are continuing to see a highly dysfunctional foreclosure process that is inefficiently dealing with delinquent mortgages -- particularly in states with a judicial foreclosure process.
"There were strong signs in the second half of 2011 that lenders are finally beginning to push through some of the delayed foreclosures in select local markets. We expect that trend to continue this year, boosting foreclosure activity for 2012 higher than it was in 2011, though still below the peak of 2010."
December activity hits 49-month low, scheduled auctions up in fourth quarter
Foreclosure filings were reported on 205,024 U.S. properties in December, a decrease of 9 percent from the previous month and down 20 percent from December 2010. December's total was the lowest monthly total since November 2007 -- a 49-month low.
December Default notices (NOD, LIS) decreased 19 percent from the previous month and were down 23 percent from December 2010; Scheduled foreclosure auctions (NTS, NFS) decreased 12 percent from the previous month and were down 24 percent from December 2010; and bank repossessions (REO) increased 10 percent from the previous month but were still down 12 percent from December 2010.
Foreclosure filings were reported on 586,133 U.S. properties in the fourth quarter, a 4 percent decrease from the previous quarter and down 27 percent from the fourth quarter of 2010. Fourth quarter default notices were down 6 percent from the previous quarter and down 22 percent from the fourth quarter of 2010; scheduled foreclosure auctions increased 4 percent from the previous quarter but were still down 32 percent from the fourth quarter of 2010; and REOs decreased 11 percent from the previous quarter and were down 24 percent from the fourth quarter of 2010.
Nevada, Arizona, California post top state foreclosure rates for year
More than 6 percent of Nevada housing units (one in 16) had at least one foreclosure filing in 2011, giving it the nation's highest state foreclosure rate for the fifth consecutive year despite a 31 percent decrease in foreclosure activity from 2010. Nevada foreclosure activity dropped 35 percent from the third quarter to the fourth quarter, driven primarily by a 70 percent decrease in default notices -- the result of a new law (AB 284) that took effect in October requiring lenders to file an additional affidavit before starting the foreclosure process. The new law also increases the penalties for the use of fraudulent documents in foreclosure.
Despite a 28 percent drop in foreclosure activity from November to December -- caused largely by a 41 percent drop in scheduled foreclosure auctions -- Arizona registered the nation's second highest state foreclosure rate for the third year in a row, with 4.14 percent of its housing units (one in 24) with at least one foreclosure filing in 2011.
California also experienced a substantial month-over-month drop in initial foreclosure notices in December -- default notices there were down 38 percent from the previous month -- but the state still registered the nation's third highest foreclosure rate for all of 2011. One in every 31 California housing units (3.19 percent) had at least one foreclosure filing during the year, down from 4.08 percent in 2010 and 4.75 percent in 2009.
Georgia posted the nation's fourth highest state foreclosure rate, with 2.71 percent of housing units (one in 37) with at least one foreclosure filing in 2011, and Utah posted the nation's fifth highest state foreclosure rate, with 2.32 percent of its housing units (one in 43) with a foreclosure filing during the year.
Other states with 2011 foreclosure rates ranking among the nation's 10 highest were Michigan (2.21 percent), Florida (2.06 percent), Illinois (1.95 percent), Colorado (1.78 percent), and Idaho (1.77 percent).
Foreclosure processing timelines continue to increase
U.S. properties foreclosed in the fourth quarter took an average of 348 days to complete the foreclosure process, up from 336 days in the third quarter and up from 305 days in the fourth quarter of 2010. The length of the average foreclosure process has increased 24 percent from 281 days in the third quarter of 2010, when lenders began to re-evaluate foreclosure procedures in earnest as the result of the so-called robo-signing controversy.
The average foreclosure process in New York has increased 37 percent during the same time period, and New York properties foreclosed in the fourth quarter took an average of 1,019 days to complete the foreclosure process -- the longest of any state.
New Jersey documented the nation's second longest average foreclosure process, at 964 days, and Florida documented the nation's third longest average foreclosure process, at 806 days. Foreclosure activity in both these states dropped more than 60 percent from 2010 to 2011. All three states with the longest foreclosure timelines employ the judicial foreclosure process.
Texas continued to register the shortest average foreclosure process of any state, at 90 days -- still an increase from 86 days in the third quarter and from 81 days in the fourth quarter of 2010. Other states with average foreclosure process among the nation's shortest in the fourth quarter were Delaware (106 days), Kentucky (108 days), Virginia (132 days), and Louisiana (134 days).
Top metro foreclosure rates
With 7.38 percent of its housing units (one in 14) with at least one foreclosure filing in 2011, Las Vegas posted the nation's top foreclosure rate for the year among metropolitan statistical areas with a population of 200,000 or more.
Ten out of the top 20 metro foreclosure rates in 2011 were in California cities, led by Stockton at No. 2, with 5.43 percent of housing units (one in 18) with at least one foreclosure filing during the year. Other California cities in the top 10 were Modesto at No. 3 (5.29 percent), Vallejo-Fairfield at No. 4 (5.20 percent), Riverside-San Bernardino at No. 5 (5.16 percent), Merced at No. 7 (4.40 percent), Bakersfield at No. 9 (4.31 percent), Sacramento at No. 10 (4.17 percent), Fresno at No. 11 (3.82 percent), Visalia at No. 13 (3.67 percent), and Ventura at No. 16 (3.27 percent).
Other metro areas with foreclosure rates ranking among the top 20 were Phoenix at No. 6 (5.10 percent); Reno, Nev., at No. 8 (4.37 percent); Atlanta at No. 12 (3.69 percent); Prescott, Ariz., at No. 14 (3.50 percent); Cape Coral-Fort Myers, Fla., at No. 15 (3.29 percent); Greeley, Colo., at No. 17 (2.97 percent); Detroit at No. 18 (2.94 percent); Boise, Idaho, at No. 19 (2.85 percent); and Salt Lake City at No. 20 (2.81 percent).
All top 20 metro areas showed a decrease in foreclosure activity from 2010, and all but Atlanta posted a decrease from 2009. Atlanta metro foreclosure activity in 2011 was up 2 percent from 2009.
Real Estate Listings Showcase


This website uses cookies to improve user experience. By using our website you consent in accordance with our Cookie Policy. Read More