The WPJ
Residential Real Estate News


Manhattan Residential Sales Slow 5% in Q3 as Listing Inventory at Seven Year Lows
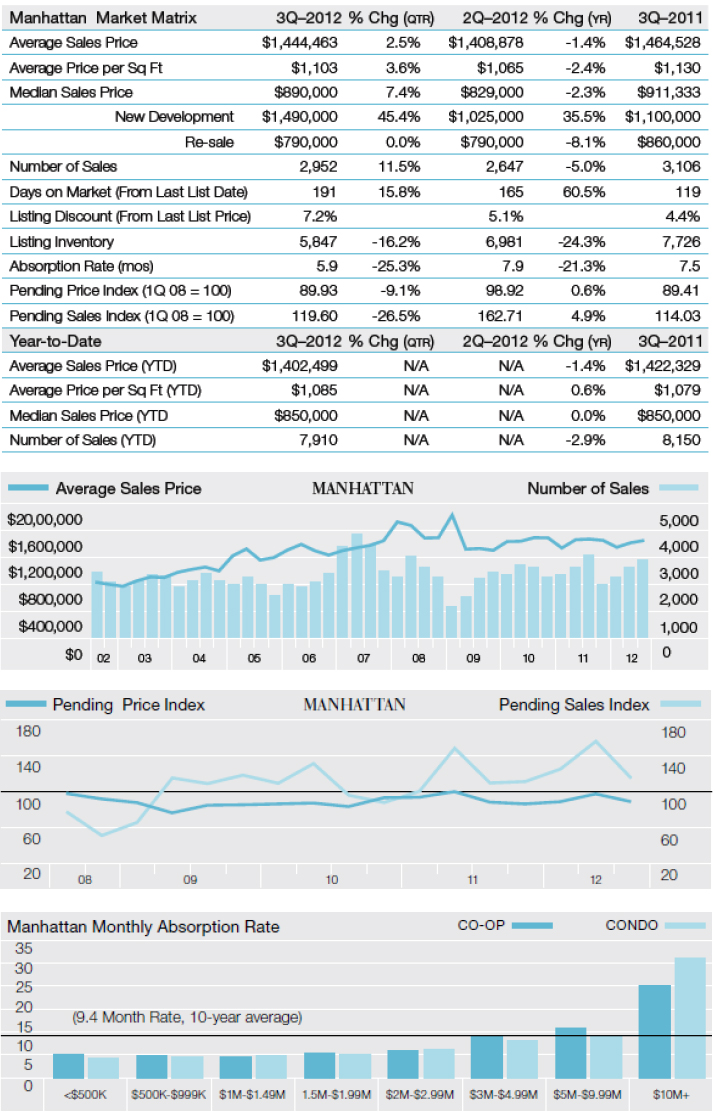
 According to Prudential Douglas Elliman's latest Manhattan Market Overview 3Q 2012, the Manhattan housing market showed seasonally stable pricing and sales activity. Smaller apartments continued to gain market share as mortgage rates continued to fall and city employment levels rose.
The sharply declining listing inventory reached a 7.5-year low, while the monthly absorption rate demonstrated a brisk market pace as it reached a 5-year low. All price indicators posted modest year-over-year declines, as 1-bedroom apartments gained 5% market share to represent 37.8% of all sales, edging out the 2-bedroom market as the largest market segment.
Co-Op and Condo Market Highlights:
- Quarterly pending sales rose as year-to-date closed sales lagged-- The pending sales index was 4.9% above year ago levels as summer contract signings were unusually heavy. Year-to-date closed sales lagged behind prior year totals by 2.9%, as 2011 saw more activity in the first half of the year.
- Listing inventory continued to decline sharply, reaching lowest level in 7.5 years-- There were 5,847 listings at the end of the quarter, 24.3% fewer than 7,726 total in the prior year quarter, marking the metric's lowest level since the first quarter of 2005. The monthly absorption rate fell to 5.9 months, the fastest market pace in five years.
- Prices showed stability. Indicators slipped as market share for 1-bedrooms jumped-- Median sales price slipped 2.3% to $890,000 from $911,333 in the prior year quarter. Market share of 1-bedroom sales jumped 5% to 37.8% over the same period.
The median sales price was $890,000, down 2.3% from $911,333 a year ago. Average sales price and average price per square foot slipped 1.4% and 2.4% from the prior year quarter to $1,444,463 and $1,103 respectively. Year-to-date, median sales price remained unchanged from a year ago at $850,000, while average price per square foot increased 0.6%, further reflecting price stability in the overall market.
There were 2,952 sales this quarter, the second highest total since the credit crunch began four years ago, second only to the prior year quarter total of 3,106. Sales in the first half of 2012 fell just short of sales in the first half of 2011. While there was a 5% decline in third quarter sales from a year ago, signed contracts increased 4.9%.
After a relatively slow summer in 2011, sales activity remained unusually high over the 2012 summer months, suggesting a possible stronger finish to the year. Average monthly maintenance was $1.62 per square foot per month, up 6.6% from $1.52 in the same period last year. Despite listing inventory continuing to drop, declining 24.3% to 5,847, its lowest level since the first quarter of 2005, only 8.5% of all sales sold for more than their list price at time of contract, down from 10.1% in the prior year quarter. As inventory fell, older listings were absorbed, resulting in a jump in days on market from 119 in the prior year quarter to 191. Listing discount increased from 4.4% to 7.2% over the same period.
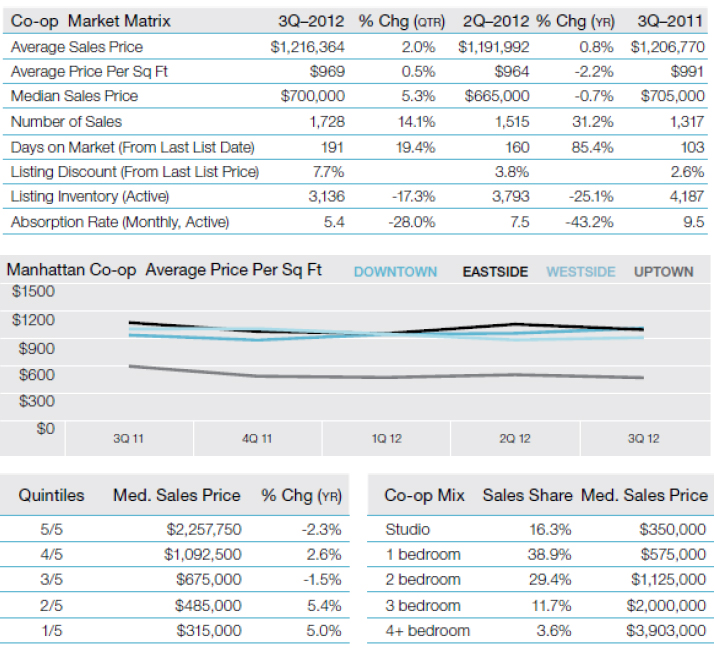
The Co-Op Market
- Price indicators were mixed as both entry-level and high-end sales rose-- The combined studio and 1-bedroom market share was 55.2%, up from 53.7% in the prior year quarter. The 3- and 4-bedroom market share jumped from 8.4% to 15.3% over the same period.
- Most co-op sales in five years-- There were 1,728 sales in the third quarter, 31.2% more than in the year ago quarter, and the highest number since 2007.
- Listing inventory fell sharply-- There were 3,136 listings at the end of the third quarter, 25.1% below year ago levels, resulting in a 5.4 month absorption rate, the fastest market pace in five years.
The median sales price edged 0.7% lower to $700,000 from $705,000 largely due to the drop in market share of 2-bedroom apartments. Typically the largest category, this segment fell to a 29.4% market share from 37.9% in the same period last year. Average sales price for the third quarter edged 0.8% higher to $1,216,364 from $1,206,770 in the same period last year. Average price per square foot slipped 2.2% to $969 from $991 in the prior year quarter. There were 1,728 sales in the third quarter, 31.2% more than 1,317 in the same period last year. Listing inventory fell 25.1% from 4,187 to 3,136 over the same period. Co-ops accounted for 58.5% of all apartment sales and 53.6% of all active apartment listings. The combination of rising sales and falling inventory resulted in a 5.4 month absorption rate, the fastest market pace in 5 years. Days on market continued to rise, reaching 191 days from 103 days in the prior year quarter, this high level of marketing time indicating that the market sold off older inventory as new listings failed to keep up with the pace of sales. The listing discount jumped to 7.7% from 2.6% in the year ago quarter. The monthly maintenance charge for all sales increased 3.8% from $1.59 per square foot per month in the prior year quarter to $1.65.
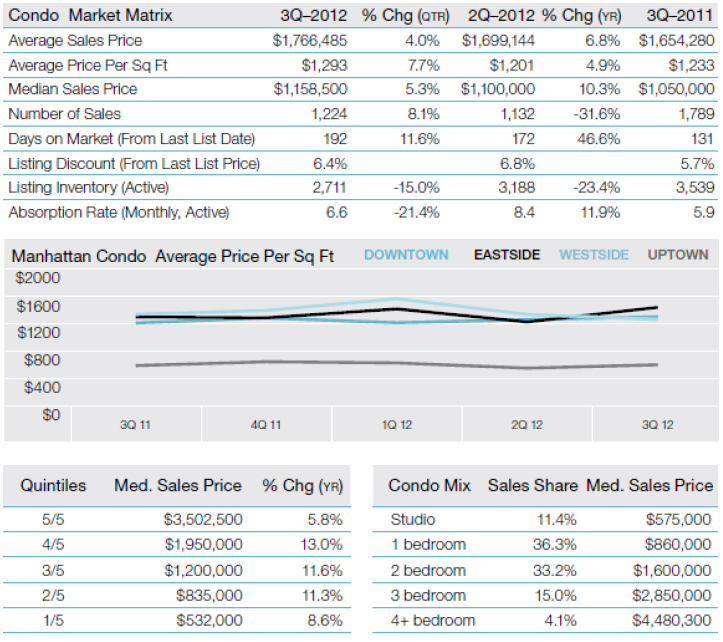
The Condo Market
- Listing inventory continued to post large year-over-year declines-- There were 2,711 listings, down 23.4% from 3,539 in the prior year quarter.
- All price indicators showed gains over prior year levels-- Median sales price was $1,158,000, 10.3% higher than in the same quarter last year. Average sales price and average price per square foot increased over the same period.
- Number of sales fell from year ago spike, but maintained brisk pace-- The sharp drop in inventory contributed to a 31.6% decline in sales; however, the pace of the market remained brisk with a 6.6 month absorption rate, compared to the 9.7 month average of the past decade.
Condo prices continued to edge higher this quarter with little change in the average size of the units that sold. Median sales price expanded 10.3% to $1,158,500 from the prior year quarter. Gains in median sales price were seen across all market quintiles, with double-digit increases in the second, third and fourth quintiles. However, the overall number of sales fell 31.6% to 1,224 units from 1,789 in the prior year quarter. The year ago spike in sales appeared to be an anomaly. There were 2,711 listings at the end of the third quarter, 23.4% fewer than in the prior year quarter. Condos accounted for 41.5% of all apartment sales and 46.4% of all active apartment listings. Consistent with the sharp drop in listing inventory, old supply was absorbed as new supply was slow to enter the market, reflected in the fact that days on market jumped to 192 days from 131 days in the prior year quarter. Listing discount expanded from 5.7% to 6.4% in the same period. The average monthly common charge and real estate tax per square foot for units sold in the third quarter was $1.58, 7.5% higher than $1.47 in the prior year quarter and up nominally from $1.57 in the prior quarter. In the third quarter, common charges of all condo sales averaged $0.96 per square foot per month and real estate taxes averaged $0.61 per square foot per month.
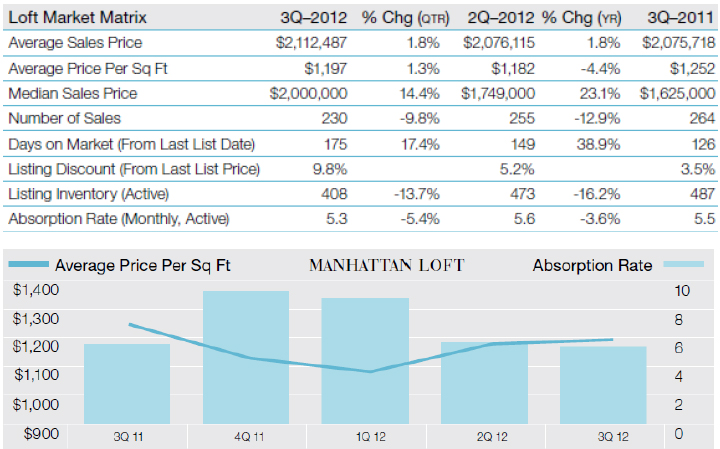
Loft Market
- Listing availability continued to fall, impacting sales-- There were 408 listings available at the end of the third quarter, down 16.2% from the prior year quarter. The number of sales fell 12.9% over the same period.
- Monthly absorption rate fell to fastest pace in nearly 9 years-- The number of months to sell all listings at the current pace of sales fell to 5.3 months, the fastest pace since the fourth quarter of 2003.
- Price indicators were generally mixed, but showed upward momentum-- The median sales price of a loft apartment jumped 23.1% to $2,000,000 from $1,625,000.
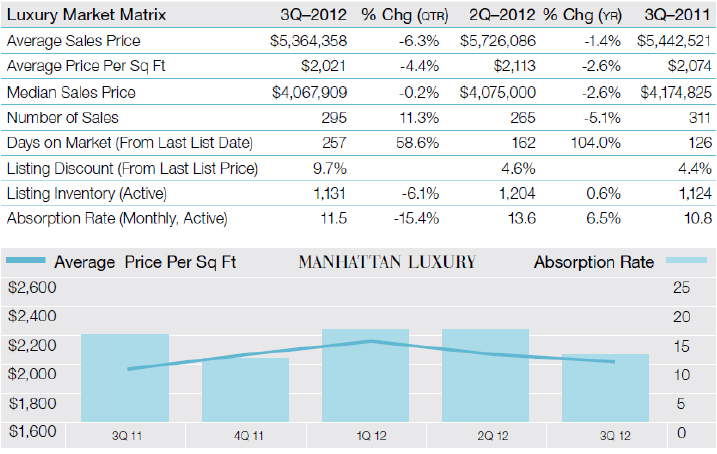
Luxury Market
- All price indicators slipped from year ago levels-- The average time to sell an apartment increased 3.5 weeks and the spread between list price and contract price expanded to 4.6% compared to the prior year quarter.
- Listing inventory stabilized-- There were 1,131 listings at the end of the third quarter, up a nominal 0.6% from 1,124 listings in the prior year quarter.
- Expanded marketing time reflected the sell off of older supply-- Days on market jumped to 257 days from 126 days in the prior year quarter.
Real Estate Listings Showcase


This website uses cookies to improve user experience. By using our website you consent in accordance with our Cookie Policy. Read More