The WPJ
Residential Real Estate News


Manhattan's Condo, Co-Op Market Posts Mixed Results in Q1
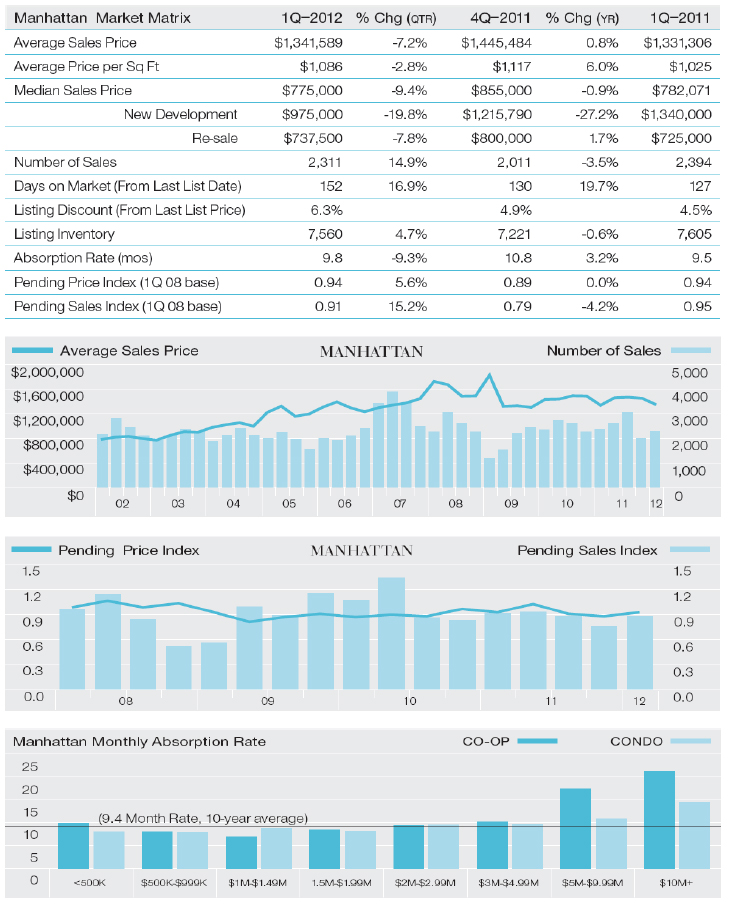
 Manhattan-based real estate firm Prudential Douglas Elliman recently shared with World Property Channel their latest Manhattan Market Overview for Q1, 2012, that reported that New York City housing prices continued to show stability. The median sales price was $775,000, 0.9% below $782,071 in the prior year quarter. Price per square foot increased 6% and average sales price increased 0.8% over the same period.
The number of sales slipped from aftermath of economic turbulence last fall 2011. The number of sales declined 3.5% to 2,311 in the first quarter from 2,394 in the prior year quarter. The S&P's downgrade of US debt, paired with the European debt crisis, Wall Street bonus concerns, and large swings in the stock market indices all contributed to the market's slowed pace last fall.
Active inventory saw a nominal decline as days on market expanded. There were 7,560 listings available, 0.6% less than 7,605 in the prior year quarter, but consistent with the 7,478 quarterly average over the past ten years. The average time to market a property slowed to 152 days from 127 days in the prior year quarter.
Despite global economic turmoil last fall, the housing market continued to show stability, continuing a pattern that began in mid- 2009 after the credit crunch began. The S&P's downgrade of US debt, paired with the European debt crisis, Wall Street bonus concerns, and large swings in the stock market indices all contributed to the market's slowed pace leading into the first quarter. As a result, the number of sales slipped 3.5% to 2,311 from 2,394 in the prior year quarter. However, sales levels began to rise during the middle of the first quarter. The price indicators continued to show stability. The median sales price slipped 0.9% to $775,000 from $782,071 in the prior year quarter, but the average sales price and price per square foot posted increases. Average price per square foot increased 6% to $1,086 from $1,025 over the same period. Average sales price edged up 0.8% to $1,341,589 from $1,331,306 in the prior year quarter. Manhattan housing prices have generally remained stable since mid-2009, a few quarters after the credit crunch began. Active listing inventory slipped 0.6% to 7,560 in the first quarter from 7,605 in the prior year quarter, but remained consistent with the 7,478 quarterly average over the past ten years. In practice, the market may feel like there are fewer apartments available, as evidenced by the rise in the listing discount. The trend suggests that more sellers are pricing properties higher than the market can support, thereby slowing the pace of sales. Days on market expanded to 152 days from 127 days in the prior year quarter. Employment conditions continued to slowly improve, inventory levels remained modest and new development stabilized, but tight mortgage underwriting conditions remain a challenge to the market. Foreign buyers and Wall Street employees still remain important contributors to housing demand. Stable prices and stable activity continue to position Manhattan as one of the better performing US metro housing markets.
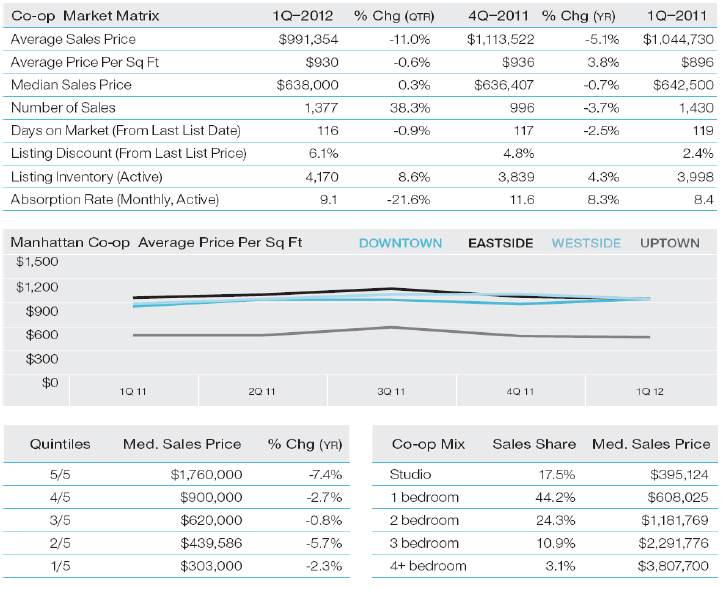
Co-Op Market
- Number of sales slipped, but are at second highest level since mid-2007-- The number of sales slipped to 1,377 from 1,430 in the prior year quarter, but jumped 38.3% from the lull in the prior quarter to more normal levels.
- Price indicators were mixed-- Median sales price slipped 0.7% to $638,000 from $642,500 in the prior year quarter.
- Listing inventory edged higher as days on market slipped-- The number of listings expanded 4.3% to 4,170 from 3,998 in the prior year quarter as days on market slipped to 116 days from 119 days over the same period.
The price indicators were mixed in the first quarter. The median sales price declined 0.7% to $638,000 from $642,500 in the prior year quarter. Average sales price declined 5.1% over the same period and was below the $1,000,000 threshold for the second time in six years. Price per square foot increased 3.8% to $930 from $896 in the prior year quarter. There were 1,377 sales in the first quarter, 3.7% less than 1,430 sales in the prior year quarter, but sharply above 996 sales in the prior quarter, as sales activity returned to levels more consistent with the past several years. After the mortgage rates dropped to record lows last fall, entry-level apartment sales jumped to 61.7% of all co-op sales, the highest share in two years. The number of co-ops listed for sale increased 4.3% to 4,170 from 3,998 in the prior year quarter, consistent with the 4,056 average for the past ten years. As a result of more inventory and fewer sales, the listing discount increased to 6.1% from 2.4% in the prior year ago quarter. Despite the expansion of inventory, days on market slipped to 116 days from 119 days over the same period. The monthly maintenance charge for all sales edged 3% higher to $1.62 per square foot per month from $1.57 per square foot per month in the prior year quarter.
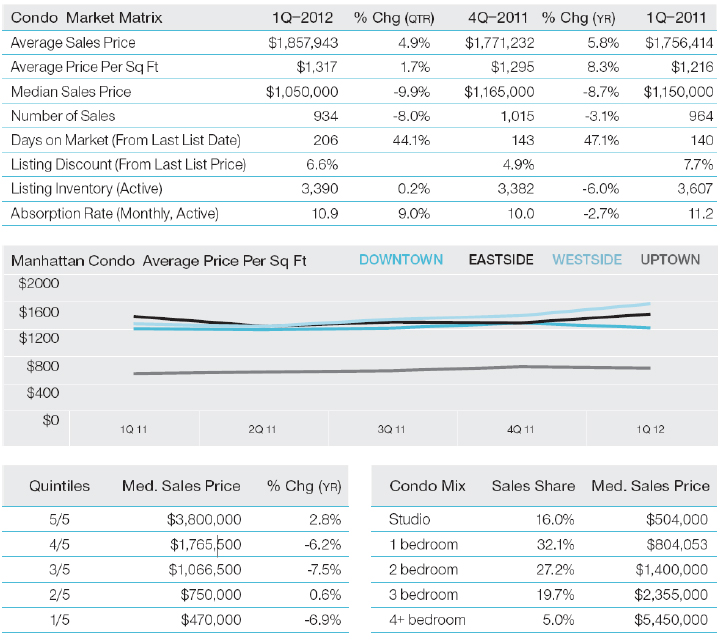
Condo Market
- Price indicators were mixed-- Median sales price fell 8.7% to $1,050,000 in the first quarter from $1,150,000 during same period last year. Average sales price and price per square foot increased 5.8% and 8.3% respectively over the same period.
- Entry-level sales and 3-bedroom market share surged-- Studio and 1-bedroom apartments jumped to 48.1% of all sales from 38.8% in the same quarter last year, while 3-bedroom market share nearly doubled to 19.7%.
- Listing inventory decline outpaced sales decline-- There were 3,390 listings at the end of the quarter down 6% from the same quarter last year. The number of sales fell 3.1% to 934 over the same period.
The market share of condos returned to the same level as last year after an unusual surge in the second half of 2011. Condos represented 40.4% of all apartment sales in the first quarter, virtually the same levels seen in the prior year quarter. The market share recently peaked in the third quarter at 57.6% with the influx of foreign buyers. However, the number of sales slipped 3.1% to 934 from the same quarter last year to its lowest level in two years. The drop was associated with the unusual spike in activity last summer working off future demand. The median sales price fell 8.7% to $1,050,000 from $1,150,000 in the prior year quarter. However, average sales price expanded 5.8% from $1,756,414 to $1,857,943, its fourth-highest level in five years. Two of the quarters with higher averages occurred pre-Lehman. Price per square foot increased 8.3% to $1,317 from $1,216 in the same quarter last year. Days on market jumped to 206 days from 140 days in the prior year quarter even though listing inventory decreased 6% over the same period. With condo sale market shares of 57.6% and 50.5% in the last two quarters of 2011, the higher activity resulted in the absorption of much older inventory, causing the days on market metric to spike. Monthly carrying costs, including common charges and real estate taxes were up 9% at $1.57 per square foot per month.
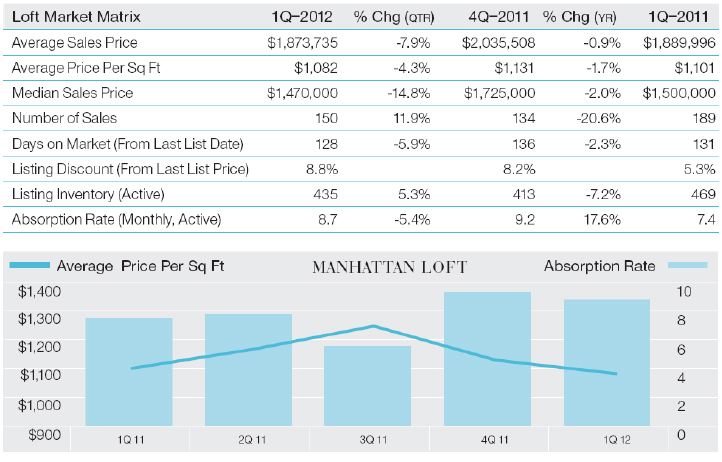
Loft Market
- Price indicators slipped-- Median sales price slipped 2% to $1,470,000 from $1,500,000 in the same quarter last year. Average sales price and price per square foot showed similar patterns.
- Listing inventory has been declining-- There were 435 lofts on the market at the end of the first quarter, down 7.2% from 469 in the same quarter last year.
- Number of sales dropped despite decline in inventory-- There were 150 sales in the first quarter, 20.6% fewer than 189 in the prior year quarter. Lofts comprised 6.5% of Manhattan sales in the first quarter, below the 7.9% ten-year average.
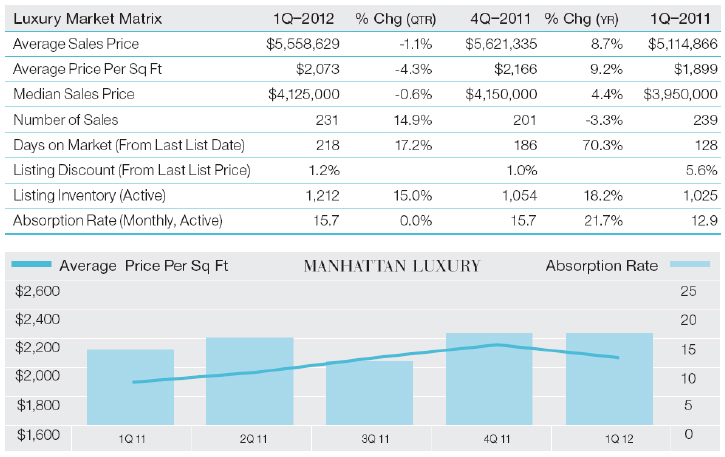
Luxury Market
- Listing inventory increased year-over-year due to re-sales-- Re-sale inventory jumped 25.1% while new development increased 4.4% over same period.
- Luxury price indicators outpaced the overall market-- Median sales price expanded 4.4% to $4,125,000 from $3,950,000 in the same period last year.
- No significant shift in mix of size or type of property-- The average size of both re-sale and new development edged up 1% and new development market share increased 2.3% over the same quarter last year.
Real Estate Listings Showcase


This website uses cookies to improve user experience. By using our website you consent in accordance with our Cookie Policy. Read More