The WPJ
Residential Real Estate News


Home Flipping Activity in U.S. Dips in Q3
Home Flipping Declines After Posting a 6-Year High in Q2
According to ATTOM Data Solutions' Q3 2016 U.S. Home Flipping Report, a total of 45,718 single family U.S. home and condo sales were flips in the third quarter of 2016, representing 5.1 percent of all single family and condo sales during the quarter. The 5.1 percent Q3 2016 home flipping rate was down from a 5.6 percent rate in the previous quarter and unchanged from Q3 2015.
The number of homes flipped decreased from a six-year high of 53,892 in the previous quarter and was down from 49,305 homes flipped in the third quarter of 2015. A total of 35,764 entities flipped properties in the third quarter, down 14 percent from a nine-year high in the previous quarter and down 7 percent from a year ago.
"While the macro trends of low housing inventory and rising home prices are favorable for flippers, they are also a double-edged sword, attracting more competition and reducing the availability of deals -- particularly in the most fundamentally sound local markets," said Daren Blomquist. "This is chasing some investors into markets and neighborhoods that may be less fundamentally sound but also offer more value-add opportunities for flippers in the form of aging housing inventory."
Share of flips purchased with cash at eight-year low
Of the 45,718 homes flipped in the third quarter, 67.9 percent were purchased with cash, down from 68.2 percent in the previous quarter and down from 69.0 percent in Q3 2015 to the lowest level since Q3 2008 -- an eight-year low.
Among 92 metropolitan areas with at least 90 homes flipped in the third quarter, those with the lowest share purchased with cash were Colorado Springs (35.6 percent); Harrisburg, Pennsylvania (39.1 percent); Denver (44.6 percent); Seattle (52.4 percent); and Providence, Rhode Island (52.8 percent).
"Home flipping is currently on the decline in the Seattle area due to inventory constraints and climbing home prices, which limit the profit potential and make these purchases inherently more risky," said Matthew Gardner, chief economist at Windermere Real Estate, covering the Seattle market. "The fact that over half of homes that are bought for flipping are financed rather than cash purchases signifies that prices are getting to levels that are out of reach for flippers. Rising mortgage rates will be a further inhibitor to home flipping and will likely cause these numbers to contract even further."
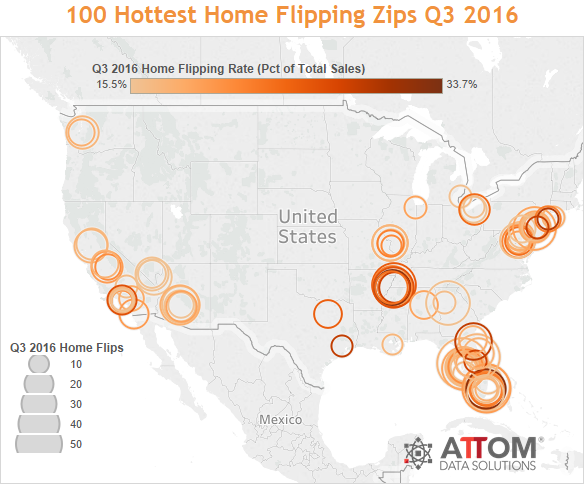
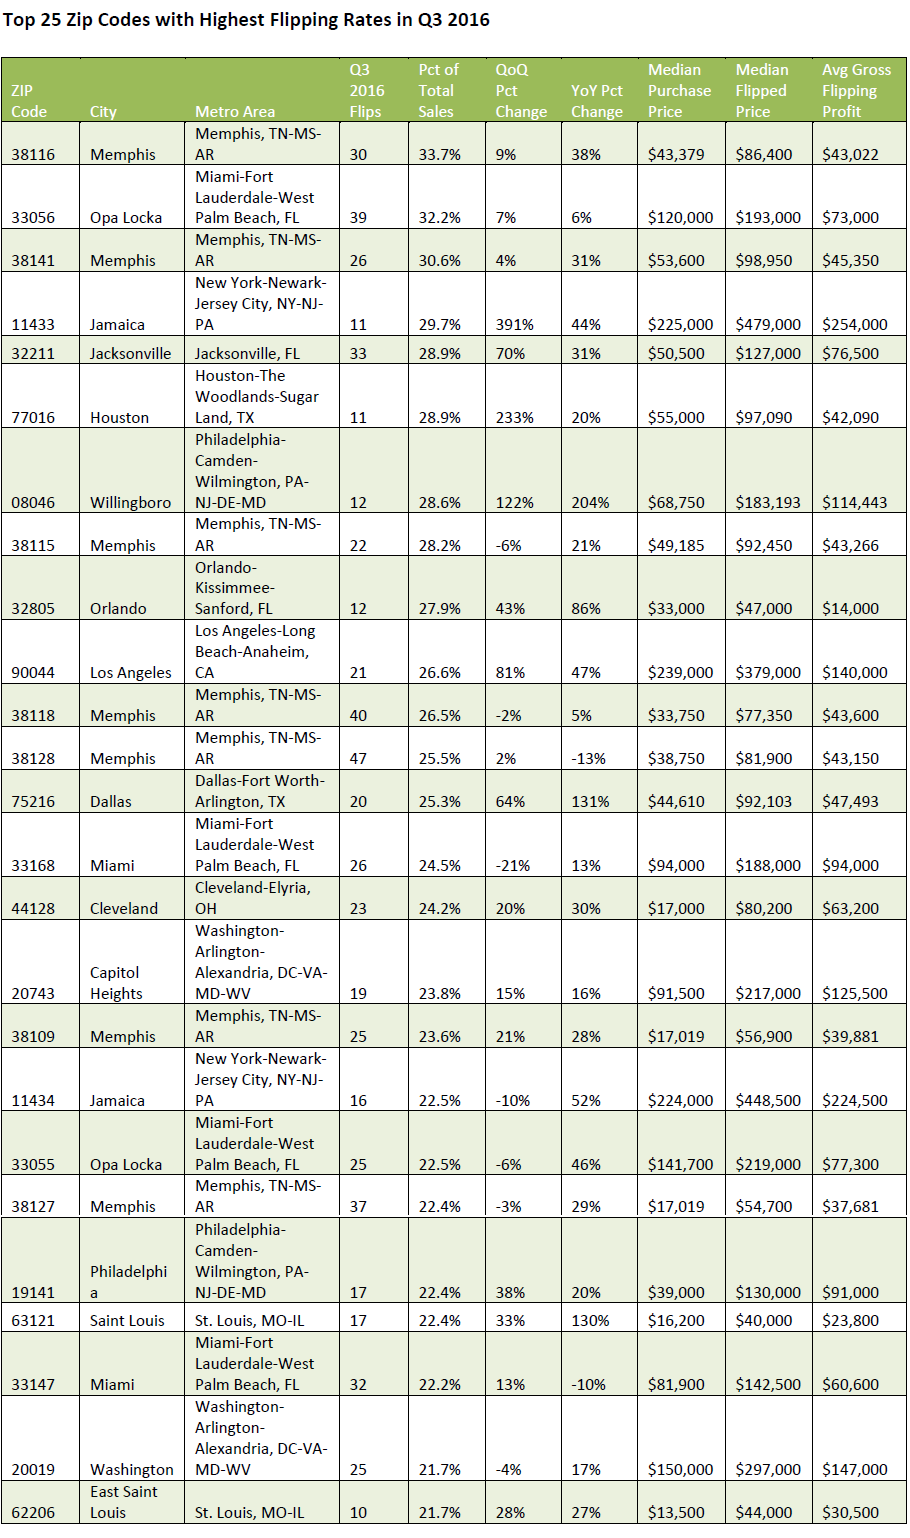
Markets with highest home flipping rate
Among 92 metropolitan statistical areas with at least 90 homes flipped in Q3 2016, those with the highest flipping rate were Memphis (11.0 percent); Clarksville, Tennessee (9.5 percent): Deltona-Daytona Beach-Ormond Beach, Florida (9.3 percent); Tampa-St. Petersburg, Florida (9.3 percent); and Visalia-Porterville, California (9.3 percent).
Other markets in the top 10 for highest flipping rate were York-Hanover, Pennsylvania (9.2 percent); Lakeland-Winter Haven, Florida (9.0 percent); Fresno, California (8.7 percent); Miami (8.6 percent); and Las Vegas (8.2 percent).
Gross flipping profit decreases from all-time high in Q2 2016
Homes flipped in Q3 2016 sold on average for $190,000, an average gross flipping profit of $60,800 more than the average purchase price of $129,200. That was down from an average gross flipping profit of $62,424 in the previous quarter -- the highest going back to Q1 2000, the earliest historical data available in the report.
The average gross flipping profit represented an average gross flipping return on investment of 47.1 percent of the purchase price, down from an average gross flipping ROI of 49.5 percent in the previous quarter and down from 47.9 percent a year ago.
"While the high-level gross flipping profits are impressive, it's important to note that they do not include all the costs incurred by flippers, including rehab, financing, property taxes and other carrying costs," Blomquist noted. "It's also important to note that the overall averages mask the fact that not every flip ends profitably for the investor. About 8 percent of the homes flipped in the third quarter actually sold for less than what the flipper purchased them for, and about 21 percent of the flips yielded a gross flipping ROI below 10 percent -- likely meaning the flipper walked away with a net loss on the deal."
Markets with highest gross flipping profits
Among the 92 metropolitan statistical areas with at least 90 home flips in Q3 2016, those with the highest average gross flipping ROI for homes flipped during the quarter were Cleveland (155.3 percent); Pittsburgh (146.9 percent); Reading, Pennsylvania (116.0 percent); Philadelphia (114.8 percent); and Clarksville, Tennessee (107.4 percent).
Other markets among the top 10 for highest average gross flipping ROI in Q3 2016 were Baltimore (100.9 percent); Dayton, Ohio (100.2 percent); New Orleans (93.7 percent); Cincinnati (90.1 percent); and Harrisburg, Pennsylvania (87.5 percent).
Flippers buying at a 25 percent discount, selling at a 7 percent premium
Homes that were flipped in Q3 2016 were purchased by the flipper at a 25.2 percent discount below full "after repair" market value on average and sold by the flipper for a 6.7 percent premium above market value on average.
Markets where flippers purchased at the biggest discount on average in Q3 2016 were Pittsburgh (53.5 percent); Reading, Pennsylvania (51.6 percent); Cleveland (51.3 percent); Clarksville, Tennessee (46.6 percent); and Philadelphia (46.3 percent).
Markets where flippers purchased at the smallest discount in Q3 2016 were Oxnard-Thousand Oaks-Ventura, California (10.2 percent); San Jose, California (12.4 percent); Denver (12.8 percent); San Diego (13.0 percent); and Los Angeles (14.3 percent).
Other high-level takeaways
- Homes flipped in Q3 2016 took an average of 180 days to flip, down from a 10-year high of 185 days in the previous quarter, but still up from an average 176 days a year ago.
- More than half (53 percent) of all homes flipped in Q3 2016 were sold by the flipper for $200,000 or less, while 33 percent of all homes flipped during the quarter were sold by the flipper for between $200,000 and $400,000. Homes flipped for $500,000 or more accounted for less than 9 percent of all flips during the quarter, and homes flipped for $1 million or more accounted for less than 2 percent of all flips during the quarter.
- Flipped homes sold by the flipper for between $50,000 and $200,000 yielded an average gross flipping ROI of 58 percent, the highest among price ranges in the third quarter. Homes flipped for between $2 million and $5 million yielded an average gross flipping ROI of 26 percent, the lowest among price ranges for the quarter.
Real Estate Listings Showcase


This website uses cookies to improve user experience. By using our website you consent in accordance with our Cookie Policy. Read More