The WPJ
Residential Real Estate News

Home Flipping in U.S. Drops to 8-Year Low in Mid 2019
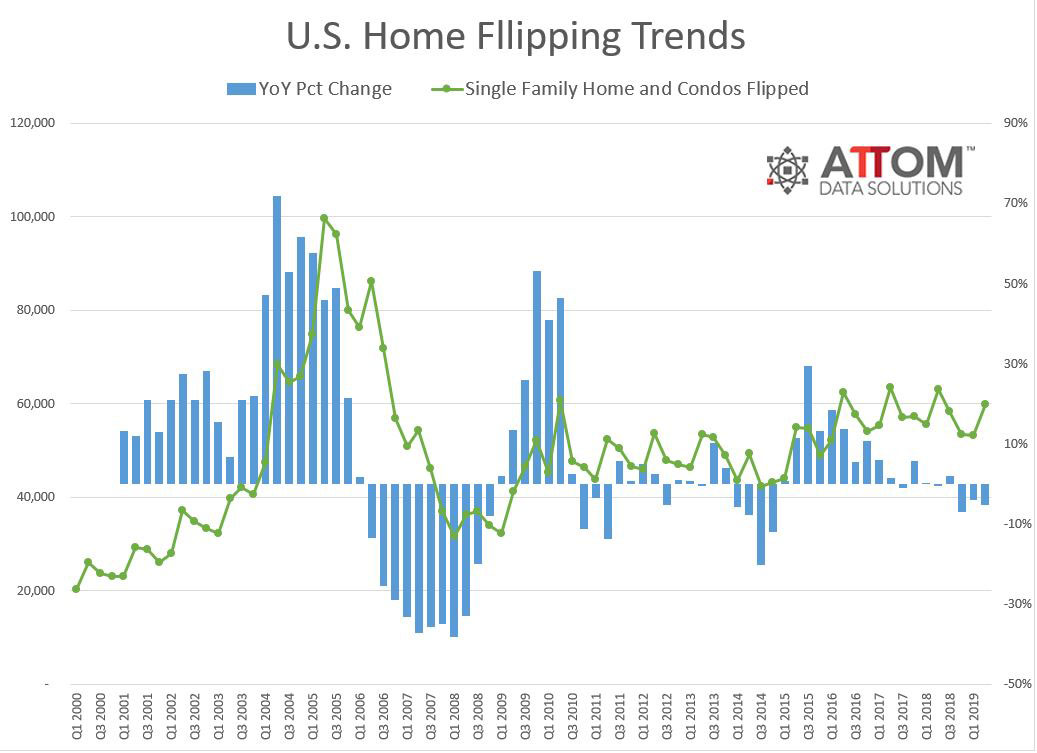
According to ATTOM Data Solutions newly released Q2 2019 U.S. Home Flipping Report, 59,876 U.S. single family homes and condos were flipped in the second quarter of 2019, up 12.4 percent from the previous quarter, but down 5.2 percent from a year ago.
The homes flipped in the second quarter represented 5.9 percent of all home sales during the quarter, down from a post-recession high of 7.2 percent in the previous quarter, but up from 5.4 percent a year ago.
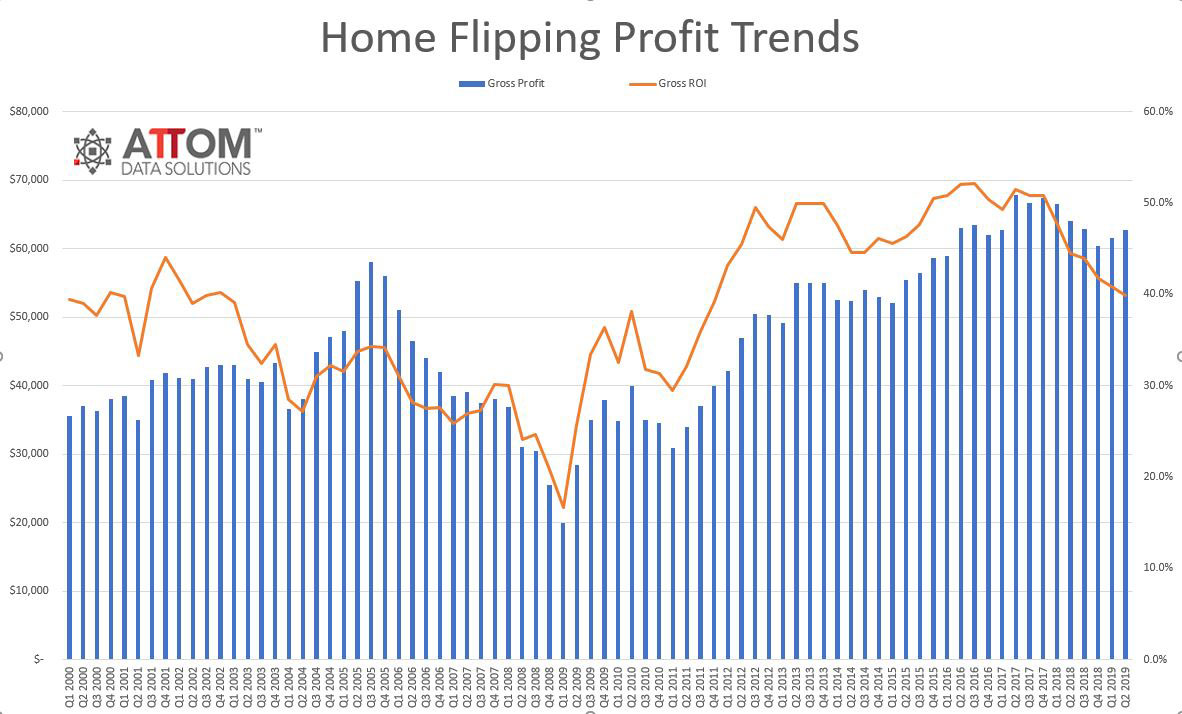
Homes flipped in Q2 2019 typically generated a gross profit of $62,700 (the difference between the median sale price and median paid by investors), up 2 percent from the previous quarter, but down 2 percent from a year ago.
The typical gross flipping profit of $62,700 in Q2 2019 translated into a 39.9 percent return on investment compared to the original acquisition price, down from a 40.9 percent gross flipping ROI in Q1 2019 and from a margin of 44.4 percent in Q2 2018. Returns on home flips have dropped six quarters in a row and eight of the last 10, now standing at the lowest level since Q4 2011.
"Home flipping keeps getting less and less profitable, which is another marker that the post-recession housing boom is softening or may be coming to an end," said Todd Teta, chief product officer at ATTOM Data Solutions. "Flipping houses is still a good business to be in and profits are healthy in most parts of the country. Butpush-and-pull forces in the housing market appear to be working less and less in investors' favor. That's leading to declining profits and a business that is nowhere near as good as it was a few years ago."
Home flipping rate up from a year ago in 70 percent of local markets
Despite the quarterly drop in home-flipping rates, 104 of 149 metropolitan statistical areas analyzed in the report (70 percent) posted a year-over-year increase in their rates in Q2 2019, including Raleigh, NC (up 72 percent); Charlotte, NC (up 54 percent); Atlanta, GA (up 46 percent); San Antonio, TX (up 46 percent) and Tucson, AZ (up 43 percent).
Among the areas analyzed, the number of homes flipped reached new peaks in Q2 2019 in 10 MSAs. The largest were Charlotte, NC; San Antonio, TX; Pittsburgh, PA; Oklahoma City, OK and Raleigh, NC.
Home flip lending volume up 31 percent from a year ago, to 13-year high
The total dollar volume of financed home flip purchases in the second quarter of 2019 was $8.4 billion, up 31.3 percent from $6.4 billion in Q2 2018 to the highest level since Q3 2006.
Flipped properties originally purchased by the investor with financing represented 41.0 percent of all home flips in Q2 2019, up slightly from 40.8 percent in the previous quarter, but down from 45.9 percent a year ago.
Among 53 metropolitan statistical areas analyzed in the report with at least 1 million people, those with the highest percentage of Q2 2019 completed flips purchased with financing were Salt Lake City, UT (93.7 percent); Austin, TX (92.6 percent); Dallas-Fort Worth, TX (86.4 percent); San Antonio, TX (83.1 percent) and Kansas City, MO (82.2 percent).
Investors are doubling their money in five markets
Among the 149 metropolitan statistical areas analyzed in the report with at least 50 home flips completed in Q2 2019, five had gross ROI flipping profits of more than 100 percent: Scranton, PA (134 percent); Pittsburgh, PA (132.5 percent); Reading, PA (129.3 percent); Kingsport, TN (104.1 percent) and Augusta, GA (101.1 percent).
Along with Pittsburgh, metro areas with a population of at least 1 million and the highest gross flipping ROI included Philadelphia, PA (99.9 percent); Cleveland, OH (98.3 percent); Baltimore, MD (91.5 percent) and Buffalo, NY (85.5 percent).
Average home flipping returns continue to slip
Homes flipped in the second quarter of 2019 were sold for a median price of $220,000, with a gross flipping profit of $62,700 above the median purchase price of $157,300. The Q2 2019 figure was up from a gross flipping profit of $61,500 in the previous quarter, but down from $64,000 in Q2 2018.
Of those 149 markets with at least 50 or more flips and a population greater than 200,000 in the second quarter of 2019, those that saw the smallest gross flipping profits were Montgomery, AL (profit of $23,250); Raleigh, NC (profit of $24,000); Springfield, MO (profit of $27,025); San Antonio, TX (profit of $27,117) and Savannah, GA (profit of $28,900).
Markets with the smallest rates of returns included Raleigh, NC (10.9 percent ROI); Las Vegas, NV (15.2 percent ROI); Phoenix, AZ (15.3 percent ROI); San Antonio, TX (15.6 percent ROI) and San Francisco, CA (17.1 percent ROI)
Areas that saw their ROIs drop most in Q2 2019 included Raleigh, NC (down 72 percent from an ROI of 38.7 percent to 10.9 percent), Savannah, GA (down 56 percent, from an ROI of 47.3 percent to 20.6 percent); San Antonio, TX (down 53 percent, from an ROI of 33 percent to 15.6 percent);
Springfield, MO (down 52 percent from an ROI of 42 percent to 20.2 percent) and Baton Rouge, LA (down 50 percent from 106.6 percent to 53.5 percent).
Average time to flip nationwide is 184 days
Homes flipped in Q2 2019 took an average of 184 days to complete the flip, up from an average of 180 days for homes flipped in Q1 2019 and up from an average of 183 days a year ago.
Among the 149 metro areas analyzed in the report, those with the shortest average days to flip were
Memphis, TN (137 days); Mobile, AL (147 days); Raleigh, NC (150 days); McAllen-Edinburg-Mission, TX (150 days) and Phoenix, AZ (151 days).
Metro areas with the longest average days to flip were Crestview-Fort Walton Beach-Destin, FL (239 days); Naples, FL (229 days); Provo, Utah (219 days); Lansing, MI (217 days) and Gainesville, FL (214 days).
Flipped homes sold to FHA buyers increases from previous quarter
Of the 59,786 U.S. homes flipped in Q2 2019, 14.4 percent were sold by the flipper to a buyer using a loan backed by the Federal Housing Administration (FHA), up from 13.8 percent in the previous quarter and up from 12.8 percent a year ago.
Among the 149 metro areas analyzed in the report, those with the highest percentage of Q2 2019 home flips sold to FHA buyers -- typically first-time homebuyers -- were Allentown, PA (29.6 percent); Port St. Lucie, FL (29.6 percent); Stockton, CA (28.5 percent); Fresno, CA (27.8 percent) and Lakeland, FL (27.7 percent).
Seventeen counties had a home flipping rate of at least 12 percent
Among 694 counties with at least 10 home flips in Q2 2019, there were 17 counties where home flips accounted for at least 12 percent of all home sales. Here are the top five: Macon County, TN in the Nashville metro area (15.8 percent); Chester County, TN in the Jackson metro area (14.7 percent); Prince George's County, MD in the Washington metro area (14.1 percent); Haralson County, GA in the Atlanta metro area (14.0 percent) and Duplin County, NC (13.9 percent).
Sixteen zip codes had a home flipping rate of at least 25 percent
Among 1,797 U.S. zip codes with at least 10 home flips in Q2 2019, there were 16 zip codes where home flips accounted for at least 25 percent of all home sales. Here are the top five: 85714 in Pima County, AZ (32.4 percent); 44110 in Cuyahoga County, OH (31.0 percent); 38109 Shelby County, TN (30.1 percent); 08083 in Camden County, NJ (28.6 percent) and 38118 in Shelby County, TN (28.0 percent).
The homes flipped in the second quarter represented 5.9 percent of all home sales during the quarter, down from a post-recession high of 7.2 percent in the previous quarter, but up from 5.4 percent a year ago.
Homes flipped in Q2 2019 typically generated a gross profit of $62,700 (the difference between the median sale price and median paid by investors), up 2 percent from the previous quarter, but down 2 percent from a year ago.
The typical gross flipping profit of $62,700 in Q2 2019 translated into a 39.9 percent return on investment compared to the original acquisition price, down from a 40.9 percent gross flipping ROI in Q1 2019 and from a margin of 44.4 percent in Q2 2018. Returns on home flips have dropped six quarters in a row and eight of the last 10, now standing at the lowest level since Q4 2011.
"Home flipping keeps getting less and less profitable, which is another marker that the post-recession housing boom is softening or may be coming to an end," said Todd Teta, chief product officer at ATTOM Data Solutions. "Flipping houses is still a good business to be in and profits are healthy in most parts of the country. Butpush-and-pull forces in the housing market appear to be working less and less in investors' favor. That's leading to declining profits and a business that is nowhere near as good as it was a few years ago."
Home flipping rate up from a year ago in 70 percent of local markets
Despite the quarterly drop in home-flipping rates, 104 of 149 metropolitan statistical areas analyzed in the report (70 percent) posted a year-over-year increase in their rates in Q2 2019, including Raleigh, NC (up 72 percent); Charlotte, NC (up 54 percent); Atlanta, GA (up 46 percent); San Antonio, TX (up 46 percent) and Tucson, AZ (up 43 percent).
Among the areas analyzed, the number of homes flipped reached new peaks in Q2 2019 in 10 MSAs. The largest were Charlotte, NC; San Antonio, TX; Pittsburgh, PA; Oklahoma City, OK and Raleigh, NC.
Home flip lending volume up 31 percent from a year ago, to 13-year high
The total dollar volume of financed home flip purchases in the second quarter of 2019 was $8.4 billion, up 31.3 percent from $6.4 billion in Q2 2018 to the highest level since Q3 2006.
Flipped properties originally purchased by the investor with financing represented 41.0 percent of all home flips in Q2 2019, up slightly from 40.8 percent in the previous quarter, but down from 45.9 percent a year ago.
Among 53 metropolitan statistical areas analyzed in the report with at least 1 million people, those with the highest percentage of Q2 2019 completed flips purchased with financing were Salt Lake City, UT (93.7 percent); Austin, TX (92.6 percent); Dallas-Fort Worth, TX (86.4 percent); San Antonio, TX (83.1 percent) and Kansas City, MO (82.2 percent).
Investors are doubling their money in five markets
Among the 149 metropolitan statistical areas analyzed in the report with at least 50 home flips completed in Q2 2019, five had gross ROI flipping profits of more than 100 percent: Scranton, PA (134 percent); Pittsburgh, PA (132.5 percent); Reading, PA (129.3 percent); Kingsport, TN (104.1 percent) and Augusta, GA (101.1 percent).
Along with Pittsburgh, metro areas with a population of at least 1 million and the highest gross flipping ROI included Philadelphia, PA (99.9 percent); Cleveland, OH (98.3 percent); Baltimore, MD (91.5 percent) and Buffalo, NY (85.5 percent).
Average home flipping returns continue to slip
Homes flipped in the second quarter of 2019 were sold for a median price of $220,000, with a gross flipping profit of $62,700 above the median purchase price of $157,300. The Q2 2019 figure was up from a gross flipping profit of $61,500 in the previous quarter, but down from $64,000 in Q2 2018.
Of those 149 markets with at least 50 or more flips and a population greater than 200,000 in the second quarter of 2019, those that saw the smallest gross flipping profits were Montgomery, AL (profit of $23,250); Raleigh, NC (profit of $24,000); Springfield, MO (profit of $27,025); San Antonio, TX (profit of $27,117) and Savannah, GA (profit of $28,900).
Markets with the smallest rates of returns included Raleigh, NC (10.9 percent ROI); Las Vegas, NV (15.2 percent ROI); Phoenix, AZ (15.3 percent ROI); San Antonio, TX (15.6 percent ROI) and San Francisco, CA (17.1 percent ROI)
Areas that saw their ROIs drop most in Q2 2019 included Raleigh, NC (down 72 percent from an ROI of 38.7 percent to 10.9 percent), Savannah, GA (down 56 percent, from an ROI of 47.3 percent to 20.6 percent); San Antonio, TX (down 53 percent, from an ROI of 33 percent to 15.6 percent);
Springfield, MO (down 52 percent from an ROI of 42 percent to 20.2 percent) and Baton Rouge, LA (down 50 percent from 106.6 percent to 53.5 percent).
Average time to flip nationwide is 184 days
Homes flipped in Q2 2019 took an average of 184 days to complete the flip, up from an average of 180 days for homes flipped in Q1 2019 and up from an average of 183 days a year ago.
Among the 149 metro areas analyzed in the report, those with the shortest average days to flip were
Memphis, TN (137 days); Mobile, AL (147 days); Raleigh, NC (150 days); McAllen-Edinburg-Mission, TX (150 days) and Phoenix, AZ (151 days).
Metro areas with the longest average days to flip were Crestview-Fort Walton Beach-Destin, FL (239 days); Naples, FL (229 days); Provo, Utah (219 days); Lansing, MI (217 days) and Gainesville, FL (214 days).
Flipped homes sold to FHA buyers increases from previous quarter
Of the 59,786 U.S. homes flipped in Q2 2019, 14.4 percent were sold by the flipper to a buyer using a loan backed by the Federal Housing Administration (FHA), up from 13.8 percent in the previous quarter and up from 12.8 percent a year ago.
Among the 149 metro areas analyzed in the report, those with the highest percentage of Q2 2019 home flips sold to FHA buyers -- typically first-time homebuyers -- were Allentown, PA (29.6 percent); Port St. Lucie, FL (29.6 percent); Stockton, CA (28.5 percent); Fresno, CA (27.8 percent) and Lakeland, FL (27.7 percent).
Seventeen counties had a home flipping rate of at least 12 percent
Among 694 counties with at least 10 home flips in Q2 2019, there were 17 counties where home flips accounted for at least 12 percent of all home sales. Here are the top five: Macon County, TN in the Nashville metro area (15.8 percent); Chester County, TN in the Jackson metro area (14.7 percent); Prince George's County, MD in the Washington metro area (14.1 percent); Haralson County, GA in the Atlanta metro area (14.0 percent) and Duplin County, NC (13.9 percent).
Sixteen zip codes had a home flipping rate of at least 25 percent
Among 1,797 U.S. zip codes with at least 10 home flips in Q2 2019, there were 16 zip codes where home flips accounted for at least 25 percent of all home sales. Here are the top five: 85714 in Pima County, AZ (32.4 percent); 44110 in Cuyahoga County, OH (31.0 percent); 38109 Shelby County, TN (30.1 percent); 08083 in Camden County, NJ (28.6 percent) and 38118 in Shelby County, TN (28.0 percent).
Real Estate Listings Showcase


This website uses cookies to improve user experience. By using our website you consent in accordance with our Cookie Policy. Read More