Residential Real Estate News


U.S. Homeowner Equity Decrease by $287 Billion Over the Last 12 Months
According to CoreLogic's latest Homeowner Equity Report for the second quarter of 2023, U.S. homeowners with mortgages (which account for roughly 63% of all properties) saw home equity decrease by 1.7% year over year, representing a collective loss of $287.6 billion, and an average loss of $8,300 per borrower since the second quarter of 2022.
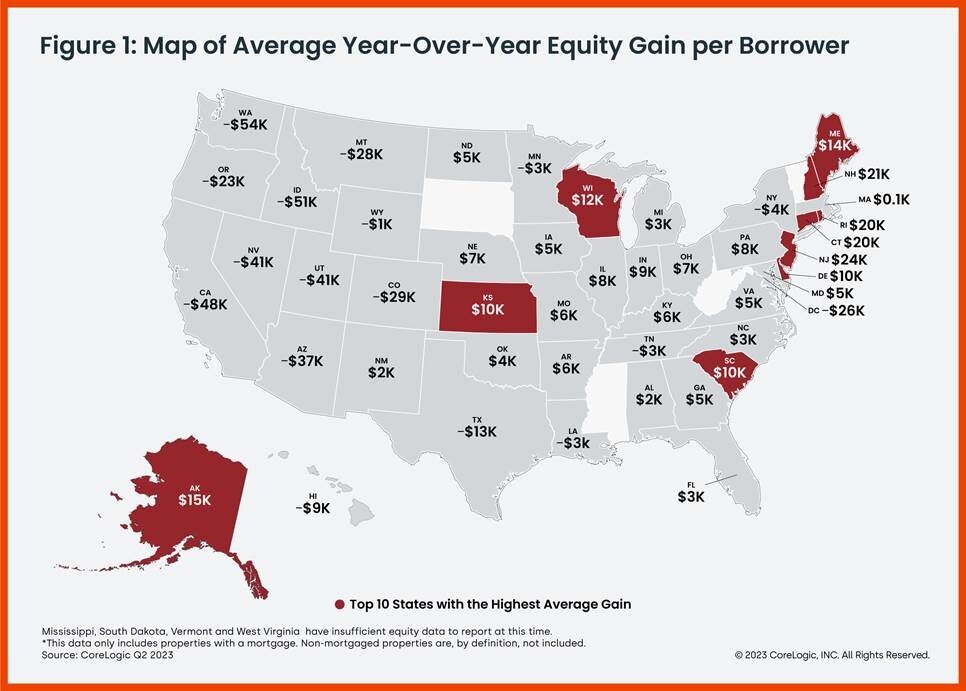
However, U.S. homeowners with mortgages gained on average $13,900 quarter over quarter, amounting to a collective increase of $806 billion - or a 5.2% gain - in home equity. And while borrowers in the West continued to experience the largest year-over-year equity losses (as seen in Figure 1), homeowners in states like Hawaii, California and Washington still have the most accumulated equity due to the pace of appreciation over the past decade.
"While U.S. home equity is now lower than its peak in the second quarter of 2022, owners are in a better position than they were six months ago, when prices bottomed out," said Selma Hepp, chief economist for CoreLogic. "The 5% overall increase in home prices since February means that the average U.S. homeowner has gained almost $14,000 compared with the previous quarter, a significant improvement for borrowers who bought when prices peaked in the spring of 2022."
"Also, while more borrowers are underwater compared with one year ago," Hepp continued, "they are not necessarily concentrated in markets that have seen the largest price declines, as negative equity also depends on the down payment. Natural disasters and related risks also play a substantial role in home equity changes."
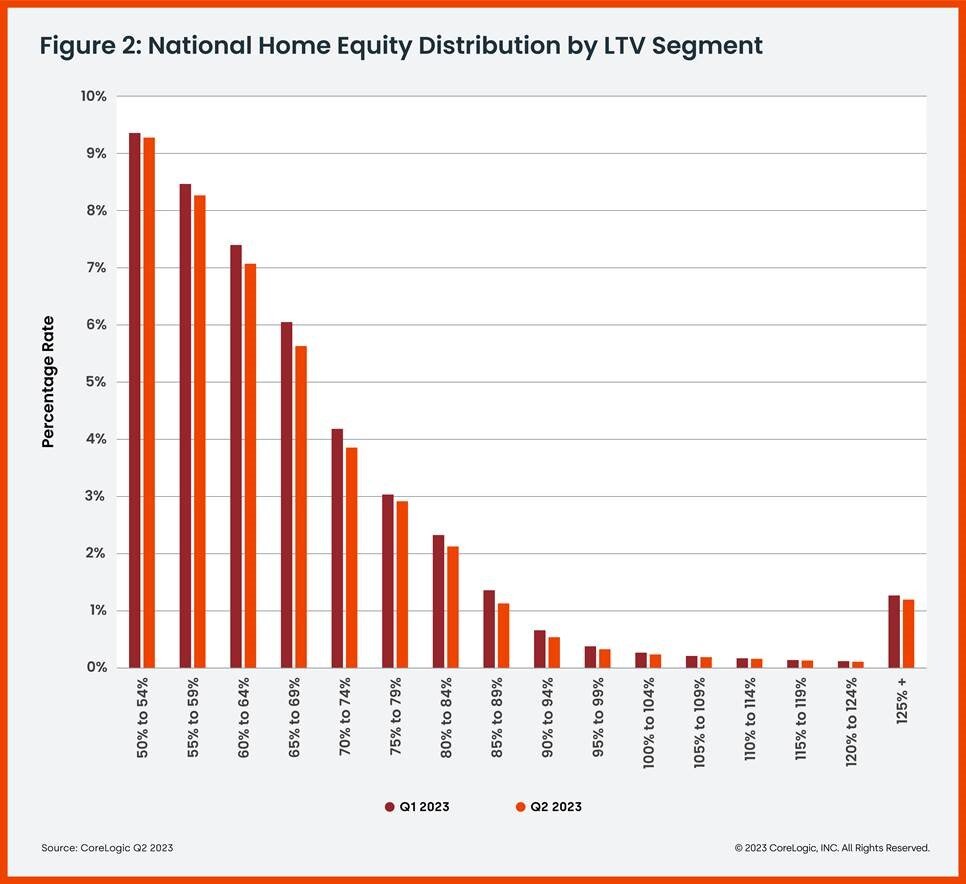
Negative equity, also referred to as underwater or upside-down mortgages, applies to borrowers who owe more on their mortgages than their homes are currently worth. As of the second quarter of 2023, the quarterly and annual changes in negative equity were:
- Quarterly change: From the first quarter of 2023 to the second quarter of 2023, the total number of mortgaged homes in negative equity decreased by 6%, to 1.11 million homes or 2% of all mortgaged properties.
- Annual change: From the second quarter of 2022 to the second quarter of 2023, the total number of homes in negative equity increased by 4% from 1.06 million homes or 1.9% of all mortgaged properties.
Because home equity is affected by home price changes, borrowers with equity positions near (+/- 5%), the negative equity cutoff, are most likely to move out of or into negative equity as prices change, respectively. Looking at the second quarter of 2023 book of mortgages, if home prices increase by 5%, 128,000 homes would regain equity; if home prices decline by 5%, 178,000 properties would fall underwater.