The WPJ
Residential Real Estate News


Home Flipping in U.S. Hits 14-Year High in Q1, Pre-Coronavirus
Yet, Typical Investment Returns Dip
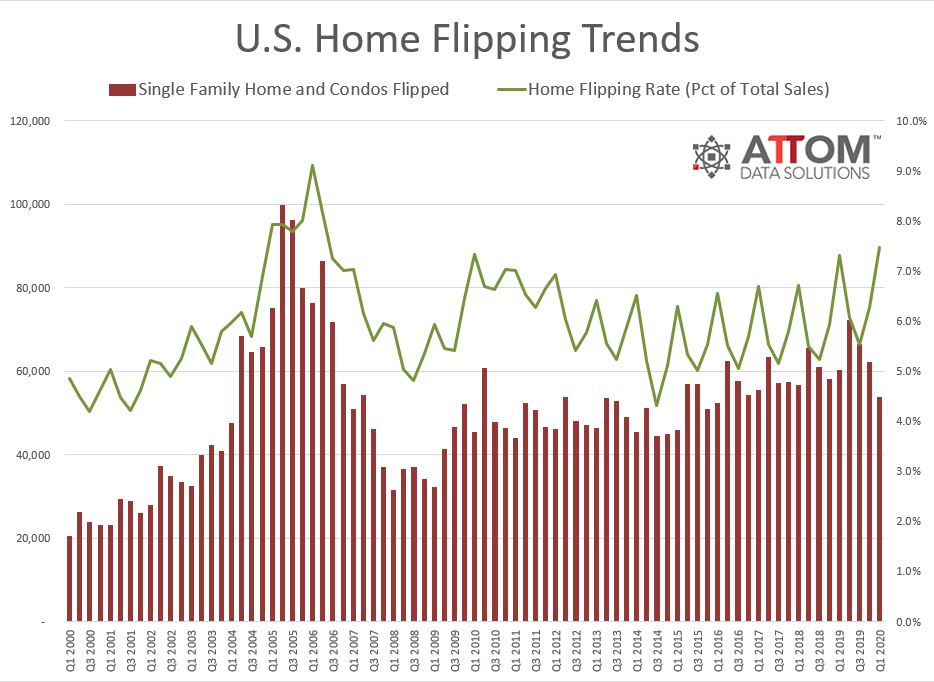
According to ATTOM Data Solutions first-quarter 2020 U.S. Home Flipping Report, 53,705 single-family homes and condominiums in the United States were flipped in the first quarter. That number represented 7.5 percent of all home sales in the nation during the quarter, up from 6.3 percent in the fourth quarter of 2019 and from 7.3 percent in the first quarter of last year, to the highest level since the second quarter of 2006.
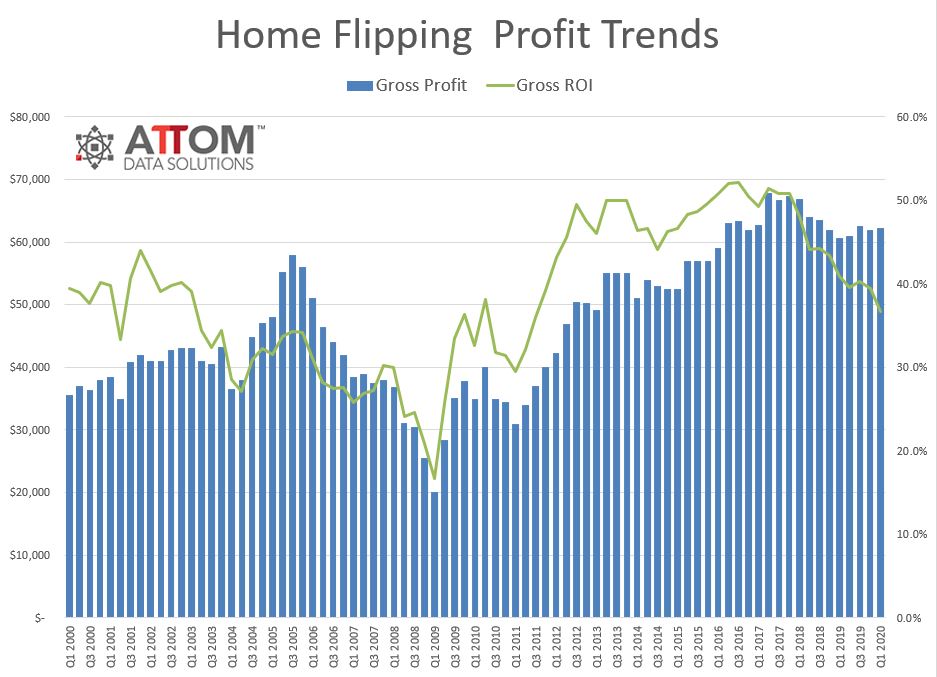
The gross profit on the typical home flip nationwide (the difference between the median sales price and the median paid by investors) also increased in the first quarter of 2020, to $62,300. That was up slightly from $62,000 in the fourth quarter of 2019 and from $60,675 in the first quarter of last year.
But with home prices rising, the typical gross flipping profit of $62,300 translated into only a 36.7 percent return on investment compared to the original acquisition price, down from a 39.5 percent gross flipping ROI in the fourth quarter of 2019 and 40.9 percent a year earlier. The latest profit margin sits at the lowest level for home flipping since the third quarter of 2011.
The first-quarter pattern of investors unable to fully keep pace with soaring home prices revealed a soft spot in the nation's nine-year market boom, just as the major impact of the worldwide Coronavirus began damaging the United States economy. While it remains unclear how hard the housing market will get hit by the pandemic fallout, a drop in prices could further erode investor profits and cloud the future of the home-flipping industry.
"Home flipping has gradually taken up a larger portion of the housing market over the last couple of years. But profits are down and are lower than they've been since the dark days following the Great Recession, which is a sign that investors aren't keeping up with price increases in the broader market," said Todd Teta, chief product officer at ATTOM Data Solutions. "Enter now the Coronavirus pandemic and the prospects for home flipping are notably uncertain, at least in the short term. We should know a lot more in a few months about whether home prices drop and investors get hit hard, or whether they can increase their profit margins."
Home flipping rates up in 87 percent of local markets
Home flips as a portion of all home sales increased from the fourth quarter of 2019 to the first quarter of 2020 in 122 of the 140 metropolitan statistical areas analyzed in the report (87.1 percent). (Metro areas were included if they had at a population of 200,000 or more and at least 50 home flips in the first quarter of 2020.)
The largest quarterly increases in home flipping rates came in Boston, MA (up 80.2 percent); Springfield, MA (up 76 percent); Olympia, WA (up 73 percent); York, PA (up 71.4 percent) and Minneapolis, MN (up 69.3 percent).
Aside from Boston, MA, and Minneapolis, MN, the biggest quarterly flipping-rate increases in 53 metro areas with a population of 1 million or more were in Grand Rapids, MI (up 57.7 percent); Richmond, VA (up 51.3 percent) and Rochester, NY (up 49 percent).
The only decreases in annual flipping rates among MSAs with a population of 1 million or more were in San Antonio, TX (down 12.9 percent); Austin, TX, (down 11.8 percent); Oklahoma City, OK (down 6.1 percent) and Houston TX (down 0.6 percent).
Highest home-flipping rates concentrated in South
Among metro areas with enough data to analyze, 11 of the top 15 home-flipping rates were in the South, led by Memphis, TN (14.5 percent of all sales); Durham, NC (13.6 percent); Phoenix, AZ (12.6 percent); Raleigh, NC (12.5 percent) and Atlanta, GA (12.4 percent).
Typical home flipping returns fall closer to post-Great Recession low points, dropping in 54 percent of markets
Homes flipped in the first quarter of 2020 were sold for a median price of $232,000, with a gross flipping profit of $62,300 above the median purchase price of $169,700. That gross-profit figure was up from $62,000 in the fourth quarter of 2019 and from $60,675 in the first quarter of last year. But with purchase prices on investment properties continuing to rise faster than resale values, the 36.7 percent return on median sales prices versus purchase prices in the first quarter of 2020 was down from 39.5 percent in the fourth of 2019 and 40.9 percent in the first quarter of last year. The latest ROI sits at the lowest point since the third quarter of 2011, when the typical home flip netted a 35.9 percent profit margin.
Profit margins decreased from the first quarter of 2019 to the first quarter of 2020 in 75 of the 140 metro areas with enough data to analyze (53.6 percent). The biggest declines were in Fort Collins, CO (return on investment down 78 percent); Greeley, CO (down 73 percent); Springfield, MO (down 64 percent); Durham, NC (down 62 percent) and Provo, UT (down 50 percent).
Among metro areas with a population of at least 1 million, the biggest declines were in Jacksonville, FL (down 45 percent); Portland, OR (down 41 percent); Raleigh, NC (down 40 percent); Tucson, AZ (down 36 percent) and Minneapolis, MN (down 32 percent).
Metro areas with a population of at least 1 million where returns on investment increased most were Dallas, TX (up 38 percent); San Antonio, TX (up 36 percent); San Diego, CA (up 20 percent); Chicago, IL (up 20 percent) and Oklahoma City, OK (up 18 percent).
Raw profits highest in the West and Northeast, lowest in the South
The highest first-quarter 2020 profits, measured in dollars, were concentrated in the West and Northeast. Among metro areas with enough data to analyze, 13 of the top 15 were in the those regions, led by San Francisco, CA (gross profit of $171,000); San Jose, CA ($165,000); Los Angeles, CA ($145,000); New York, NY ($141,899) and Honolulu, HI ($140,190).
Ten of the lowest 15 profits, in dollars, were spread across southern metro areas, led by Fort Collins, CO ($14,000 profit); Springfield, MO ($20,203); Daphne, AL ($20,650); Raleigh, NC ($21,250) and Durham, NC ($25,000).
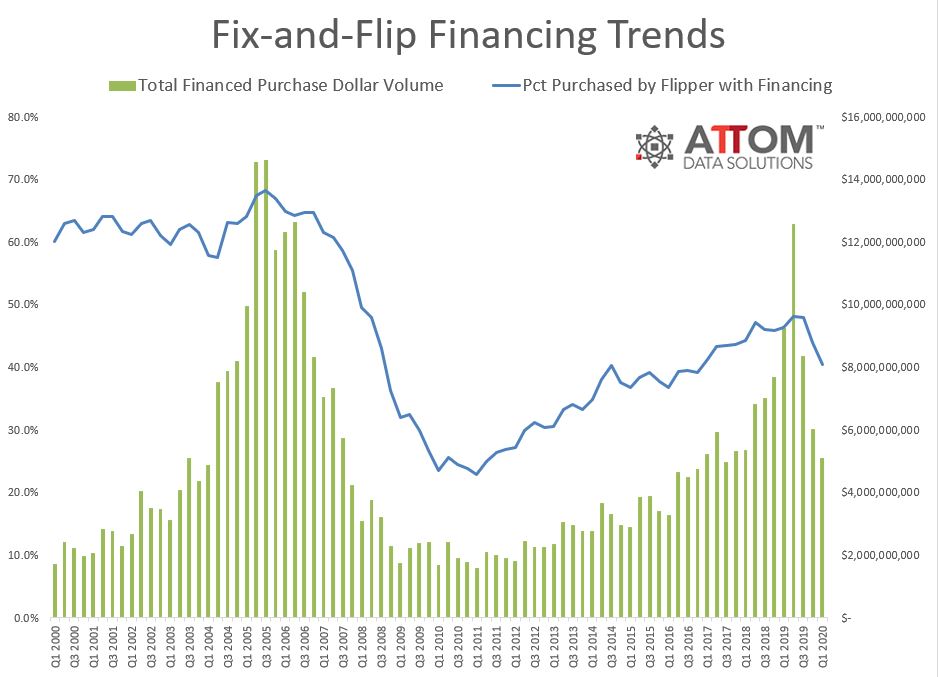
Home flips purchased with financing dip while those bought with cash climb
Nationally, the percentage of flipped homes purchased with financing dipped in the first quarter of 2020 to 40.5 percent, from 44 percent in the fourth quarter of 2019 and 46.4 percent in the first quarter of 2019, to the lowest point since the fourth quarter of 2016. Meanwhile, 59.5 percent of homes flipped in the first quarter of 2020 were bought with all-cash, up from 56 percent in the prior quarter and 53.6 percent a year earlier.
Average time to flip nationwide is 174 days
Home flippers who sold homes in the first quarter of 2020 took an average of 174 days to complete a flip, up from an average of 169 in the fourth quarter of 2019 but down from 180 days in the first quarter of last year.
Percent of flipped homes sold to FHA buyers increases
Of the 53,705 U.S. homes flipped in the first quarter of 2020, 15.3 percent were sold to buyers using a loan backed by the Federal Housing Administration (FHA), up from 14.6 percent in the prior quarter and from 13.5 percent in the same period a year ago.
Among the 140 metro areas with a population of at least 200,000 and at least 50 home flips in the first quarter of 2020, those with the highest percentage of home flips sold to FHA buyers -- typically first-time homebuyers -- were Stockton, CA (44 percent); Visalia, CA (37.5 percent); Springfield, MA (37.1 percent); El Paso, TX (33.3 percent) and Modesto, CA (31.6 percent).
More than 100 counties had home flipping rates of at least 10 percent
Among 639 counties with at least 10 home flips in the first quarter of 2020, there were 113 counties whose home flipping rate was at least 10 percent of all home sales. The top five were Marion County, IL, outside of St. Louis, MO, (28.6 percent home flipping rate); Hampton City/County, VA, in the Virginia Beach metro area (27.3 percent); Macon County, TN , in the Nashville metro area (17.9 percent); Smith County, TN, in the Nashville metro area (16.4 percent) and Paulding County, GA, in the Atlanta metro area (16.4 percent).
Twenty-nine zip codes had home flipping rates of at least 25 percent
Among 1,560 U.S. zip codes with at least 10 or more home flips in the first quarter of 2020, there were 29 zip codes where flips accounted for at least 25 percent of all home sales last year. The top five were 38109 in Shelby County (Memphis), TN (36 percent); 43203 in Franklin County (Columbus), OH (35.7 percent); 90044 in Los Angeles County, CA (35.2 percent); 90222 in Los Angeles County, CA (34.9 percent) and 38680 in DeSoto County, MS (south of Memphis, TN) (32.4 percent).
According to ATTOM Data Solutions first-quarter 2020 U.S. Home Flipping Report, 53,705 single-family homes and condominiums in the United States were flipped in the first quarter. That number represented 7.5 percent of all home sales in the nation during the quarter, up from 6.3 percent in the fourth quarter of 2019 and from 7.3 percent in the first quarter of last year, to the highest level since the second quarter of 2006.
The gross profit on the typical home flip nationwide (the difference between the median sales price and the median paid by investors) also increased in the first quarter of 2020, to $62,300. That was up slightly from $62,000 in the fourth quarter of 2019 and from $60,675 in the first quarter of last year.
But with home prices rising, the typical gross flipping profit of $62,300 translated into only a 36.7 percent return on investment compared to the original acquisition price, down from a 39.5 percent gross flipping ROI in the fourth quarter of 2019 and 40.9 percent a year earlier. The latest profit margin sits at the lowest level for home flipping since the third quarter of 2011.
The first-quarter pattern of investors unable to fully keep pace with soaring home prices revealed a soft spot in the nation's nine-year market boom, just as the major impact of the worldwide Coronavirus began damaging the United States economy. While it remains unclear how hard the housing market will get hit by the pandemic fallout, a drop in prices could further erode investor profits and cloud the future of the home-flipping industry.
"Home flipping has gradually taken up a larger portion of the housing market over the last couple of years. But profits are down and are lower than they've been since the dark days following the Great Recession, which is a sign that investors aren't keeping up with price increases in the broader market," said Todd Teta, chief product officer at ATTOM Data Solutions. "Enter now the Coronavirus pandemic and the prospects for home flipping are notably uncertain, at least in the short term. We should know a lot more in a few months about whether home prices drop and investors get hit hard, or whether they can increase their profit margins."
Home flipping rates up in 87 percent of local markets
Home flips as a portion of all home sales increased from the fourth quarter of 2019 to the first quarter of 2020 in 122 of the 140 metropolitan statistical areas analyzed in the report (87.1 percent). (Metro areas were included if they had at a population of 200,000 or more and at least 50 home flips in the first quarter of 2020.)
The largest quarterly increases in home flipping rates came in Boston, MA (up 80.2 percent); Springfield, MA (up 76 percent); Olympia, WA (up 73 percent); York, PA (up 71.4 percent) and Minneapolis, MN (up 69.3 percent).
Aside from Boston, MA, and Minneapolis, MN, the biggest quarterly flipping-rate increases in 53 metro areas with a population of 1 million or more were in Grand Rapids, MI (up 57.7 percent); Richmond, VA (up 51.3 percent) and Rochester, NY (up 49 percent).
The only decreases in annual flipping rates among MSAs with a population of 1 million or more were in San Antonio, TX (down 12.9 percent); Austin, TX, (down 11.8 percent); Oklahoma City, OK (down 6.1 percent) and Houston TX (down 0.6 percent).
Highest home-flipping rates concentrated in South
Among metro areas with enough data to analyze, 11 of the top 15 home-flipping rates were in the South, led by Memphis, TN (14.5 percent of all sales); Durham, NC (13.6 percent); Phoenix, AZ (12.6 percent); Raleigh, NC (12.5 percent) and Atlanta, GA (12.4 percent).
Typical home flipping returns fall closer to post-Great Recession low points, dropping in 54 percent of markets
Homes flipped in the first quarter of 2020 were sold for a median price of $232,000, with a gross flipping profit of $62,300 above the median purchase price of $169,700. That gross-profit figure was up from $62,000 in the fourth quarter of 2019 and from $60,675 in the first quarter of last year. But with purchase prices on investment properties continuing to rise faster than resale values, the 36.7 percent return on median sales prices versus purchase prices in the first quarter of 2020 was down from 39.5 percent in the fourth of 2019 and 40.9 percent in the first quarter of last year. The latest ROI sits at the lowest point since the third quarter of 2011, when the typical home flip netted a 35.9 percent profit margin.
Profit margins decreased from the first quarter of 2019 to the first quarter of 2020 in 75 of the 140 metro areas with enough data to analyze (53.6 percent). The biggest declines were in Fort Collins, CO (return on investment down 78 percent); Greeley, CO (down 73 percent); Springfield, MO (down 64 percent); Durham, NC (down 62 percent) and Provo, UT (down 50 percent).
Among metro areas with a population of at least 1 million, the biggest declines were in Jacksonville, FL (down 45 percent); Portland, OR (down 41 percent); Raleigh, NC (down 40 percent); Tucson, AZ (down 36 percent) and Minneapolis, MN (down 32 percent).
Metro areas with a population of at least 1 million where returns on investment increased most were Dallas, TX (up 38 percent); San Antonio, TX (up 36 percent); San Diego, CA (up 20 percent); Chicago, IL (up 20 percent) and Oklahoma City, OK (up 18 percent).
Raw profits highest in the West and Northeast, lowest in the South
The highest first-quarter 2020 profits, measured in dollars, were concentrated in the West and Northeast. Among metro areas with enough data to analyze, 13 of the top 15 were in the those regions, led by San Francisco, CA (gross profit of $171,000); San Jose, CA ($165,000); Los Angeles, CA ($145,000); New York, NY ($141,899) and Honolulu, HI ($140,190).
Ten of the lowest 15 profits, in dollars, were spread across southern metro areas, led by Fort Collins, CO ($14,000 profit); Springfield, MO ($20,203); Daphne, AL ($20,650); Raleigh, NC ($21,250) and Durham, NC ($25,000).
Home flips purchased with financing dip while those bought with cash climb
Nationally, the percentage of flipped homes purchased with financing dipped in the first quarter of 2020 to 40.5 percent, from 44 percent in the fourth quarter of 2019 and 46.4 percent in the first quarter of 2019, to the lowest point since the fourth quarter of 2016. Meanwhile, 59.5 percent of homes flipped in the first quarter of 2020 were bought with all-cash, up from 56 percent in the prior quarter and 53.6 percent a year earlier.
Average time to flip nationwide is 174 days
Home flippers who sold homes in the first quarter of 2020 took an average of 174 days to complete a flip, up from an average of 169 in the fourth quarter of 2019 but down from 180 days in the first quarter of last year.
Percent of flipped homes sold to FHA buyers increases
Of the 53,705 U.S. homes flipped in the first quarter of 2020, 15.3 percent were sold to buyers using a loan backed by the Federal Housing Administration (FHA), up from 14.6 percent in the prior quarter and from 13.5 percent in the same period a year ago.
Among the 140 metro areas with a population of at least 200,000 and at least 50 home flips in the first quarter of 2020, those with the highest percentage of home flips sold to FHA buyers -- typically first-time homebuyers -- were Stockton, CA (44 percent); Visalia, CA (37.5 percent); Springfield, MA (37.1 percent); El Paso, TX (33.3 percent) and Modesto, CA (31.6 percent).
More than 100 counties had home flipping rates of at least 10 percent
Among 639 counties with at least 10 home flips in the first quarter of 2020, there were 113 counties whose home flipping rate was at least 10 percent of all home sales. The top five were Marion County, IL, outside of St. Louis, MO, (28.6 percent home flipping rate); Hampton City/County, VA, in the Virginia Beach metro area (27.3 percent); Macon County, TN , in the Nashville metro area (17.9 percent); Smith County, TN, in the Nashville metro area (16.4 percent) and Paulding County, GA, in the Atlanta metro area (16.4 percent).
Twenty-nine zip codes had home flipping rates of at least 25 percent
Among 1,560 U.S. zip codes with at least 10 or more home flips in the first quarter of 2020, there were 29 zip codes where flips accounted for at least 25 percent of all home sales last year. The top five were 38109 in Shelby County (Memphis), TN (36 percent); 43203 in Franklin County (Columbus), OH (35.7 percent); 90044 in Los Angeles County, CA (35.2 percent); 90222 in Los Angeles County, CA (34.9 percent) and 38680 in DeSoto County, MS (south of Memphis, TN) (32.4 percent).
Real Estate Listings Showcase


This website uses cookies to improve user experience. By using our website you consent in accordance with our Cookie Policy. Read More