The WPJ
Residential Real Estate News


U.S. Home Prices Grew at Twice Rate of Inflation in 2014
According to the S&P/Case-Shiller Home Price Indices released this week for December 2014, the U.S. housing industry enjoyed a slight uptick in home prices across the country. Nine cities reported monthly increases in prices, yet all is not what it seems below the surface of the data.
"The housing recovery is faltering. While prices and sales of existing homes are close to normal, construction and new home sales remain weak. Before the current business cycle, any time housing starts were at their current level of about one million at annual rates, the economy was in a recession" says David M. Blitzer, Managing Director and Chairman of the Index Committee at S&P Dow Jones Indices.
"The softness in housing is despite favorable conditions elsewhere in the economy: strong job growth, a declining unemployment rate, continued low interest rates and positive consumer confidence. "Movements in home prices show clear regional patterns. The western half of the nation plus Miami and Atlanta enjoyed year-over-year increases of 5% or more. San Francisco and Miami were the strongest. Dallas, Denver, Las Vegas and Atlanta also experienced solid gains. Phoenix was an exception to the western strength with only a 2.4% increase; San Diego was a bit under 5% at 4.8%. The Midwest and Northeast lagged. Boston was the strongest among this weak group with prices up 3.8%. The regional patterns and the weakness in new construction and new sales may reflect decreasing mobility - fewer people moving to different parts of the country or seeking jobs in different regions."
S&P/Case-Shiller Home Price Indices high-level report data for December 2014:
- Both the 10-City and 20-City Composites saw year-over-year increases in December compared to November.
- The 10-City Composite gained 4.3% year-over-year, up from 4.2% in November. The 20-City Composite gained 4.5% year-over-year, compared to a 4.3% increase in November.
- The S&P/Case-Shiller U.S. National Home Price Index, which covers all nine U.S. census divisions, recorded a 4.6% annual gain in December 2014 versus 4.7% in November.
- The fastest year-over-year gains were in San Francisco and Miami, where prices rose 9.3% and 8.4% over the last 12 months.
- Twelve cities, including Cleveland, Denver, and Seattle, saw prices rise faster in the year to December than a month earlier. Las Vegas led the declining annual returns with 6.9%, down from 7.7% annually.
- Month-over-month, The National index was slightly negative in December, while both composite Indices were positive.
- Miami and Denver led all cities in December with increases of 0.7% and 0.5% respectively. Chicago and Cleveland offset those gains by reporting decreases of -0.9% and -0.5% respectively.
- As of December 2014, average home prices for the MSAs within the 10-City and 20-City Composites are back to their autumn 2004 levels.
- Measured from their June/July 2006 peaks, the peak-to-current decline for both Composites is approximately 16-17%.
- Since the March 2012 lows, the 10-City and 20-City Composites have recovered 28.2% and 29.1%.
Year-over-Year Data
Both the 10-City and 20-City Composites saw year-over-year increases in December compared to November. The 10-City Composite gained 4.3% year-over-year, up from 4.2% in November. The 20- City Composite gained 4.5% year-over-year, compared to a 4.3% increase in November. The S&P/Case-Shiller U.S. National Home Price Index, which covers all nine U.S. census divisions, recorded a 4.6% annual gain in December 2014 versus 4.7% in November. The fastest year-over-year gains were in San Francisco and Miami, where prices rose 9.3% and 8.4% over the last 12 months. Twelve cities, including Cleveland, Denver, and Seattle, saw prices rise faster in the year to December than a month earlier. Las Vegas led the declining annual returns with 6.9%, down from 7.7% annually.
Month-over-Month Data
The National index was slightly negative in December, while both composite Indices were positive. Both the 10- and 20-City Composites reported slight increases of 0.1%, while the National Index posted a -0.1% change for the month. Miami and Denver led all cities in December with increases of 0.7% and 0.5% respectively. Chicago and Cleveland offset those gains by reporting decreases of -0.9% and -0.5% respectively. December recorded mixed monthly figures. Nine cities recorded higher monthly figures, and six posted decreases. Five cities reported relatively flat monthly changes for December. Miami had the largest increase of all 20 cities at 0.7% month-over-month.
Graphical Representations of the U.S. Housing Market
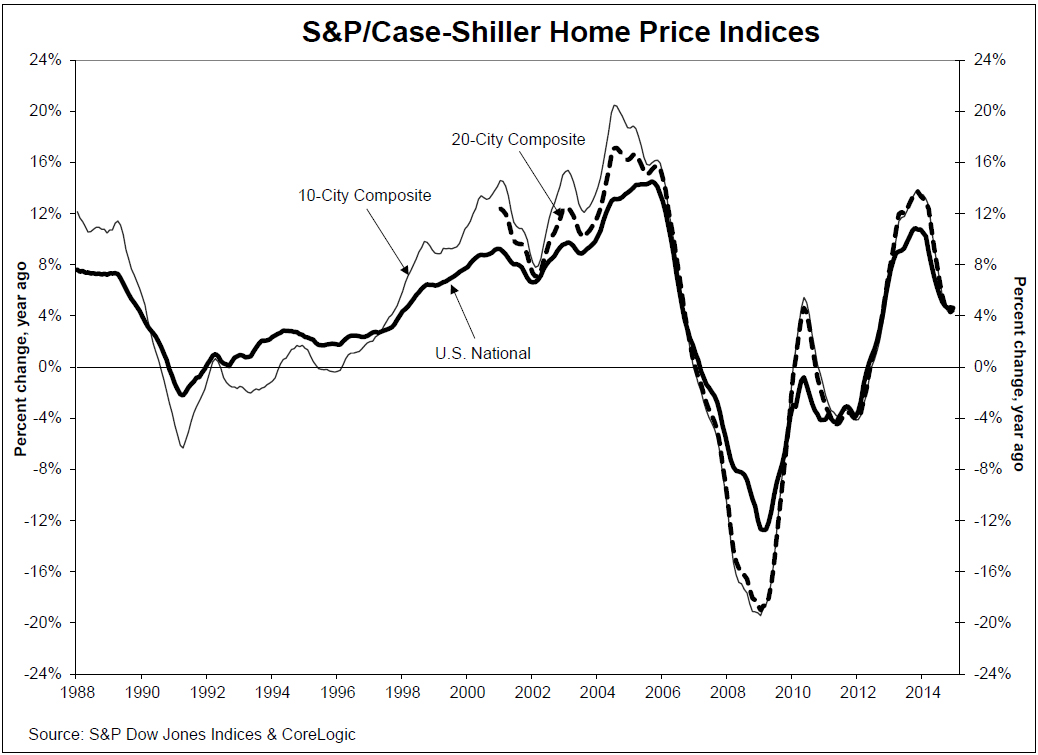
Chart 1 below depicts the annual returns of the U.S. National, the 10-City Composite and the 20-City Composite Home Price Indices. The S&P/Case-Shiller U.S. National Home Price Index, which covers all nine U.S. census divisions, recorded a 4.6% annual gain in December 2014. The 10- and 20-City Composites reported year-over-year increases of 4.3% and 4.5%.
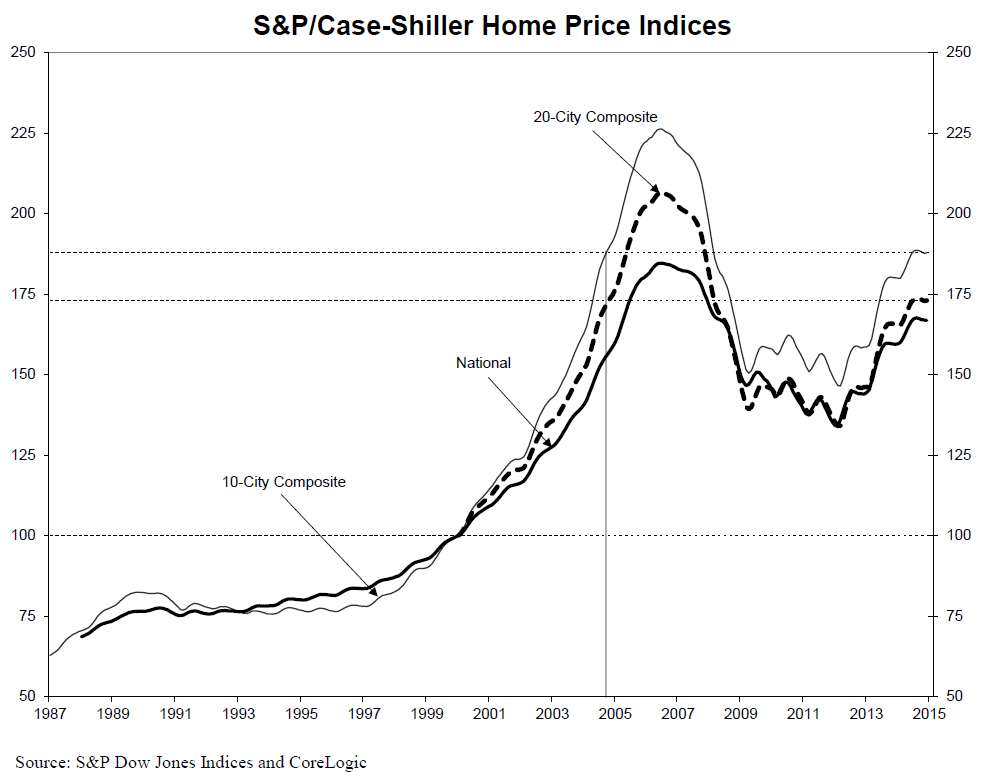
Chart 2 below shows the index levels for the U.S. National, 10-City and 20-City Composite Indices. As of December 2014, average home prices for the MSAs within the 10-City and 20-City Composites are back to their autumn 2004 levels. Measured from their June/July 2006 peaks, the peak-to-current decline for both Composites is approximately 16-17%. Since the March 2012 lows, the 10-City and 20-City Composites have recovered 28.2% and 29.1%.
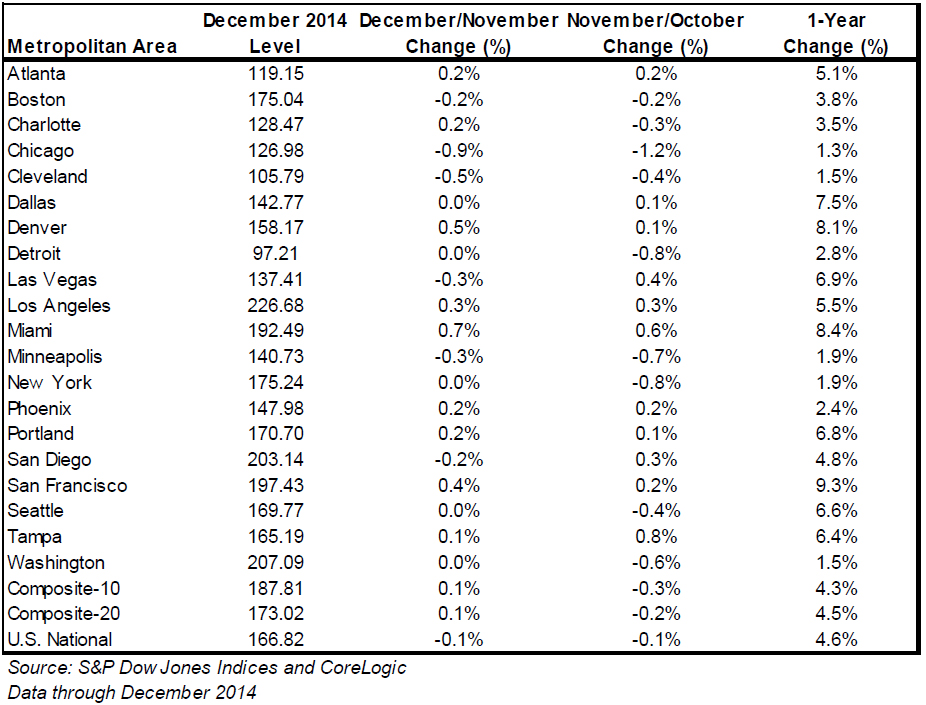
Table 1 below summarizes the results for December 2014. The S&P/Case-Shiller Home Price Indices are revised for the prior 24 months, based on the receipt of additional source data.
Real Estate Listings Showcase


This website uses cookies to improve user experience. By using our website you consent in accordance with our Cookie Policy. Read More