The WPJ
Residential Real Estate News


A Year After Amazon Announcement: Have Home Prices Changed in HQ2 Target Cities?
A year has passed since Amazon announced they had chosen its new HQ2 cities, and one burning question remains: Has the news had any noticeable effect on the Washington, D.C. housing market?
According to new research by CoreLogic's Deputy Chief Economist Ralph B. McLaughlin, his findings are threefold.
First, CoreLogic sees little evidence the metro area has experienced a large increase in housing prices since the November 2018 announcement.
Second, and in contrast, some individual zip codes - especially those near the HQ2 location - have had a strong uptick in price gains since the announcement.
Lastly discovered, relationship between proximity to the HQ2 site and home price gains have strengthened remarkably since March 2019.
Regional Home Price Growth Since the HQ2 Announcement Muted
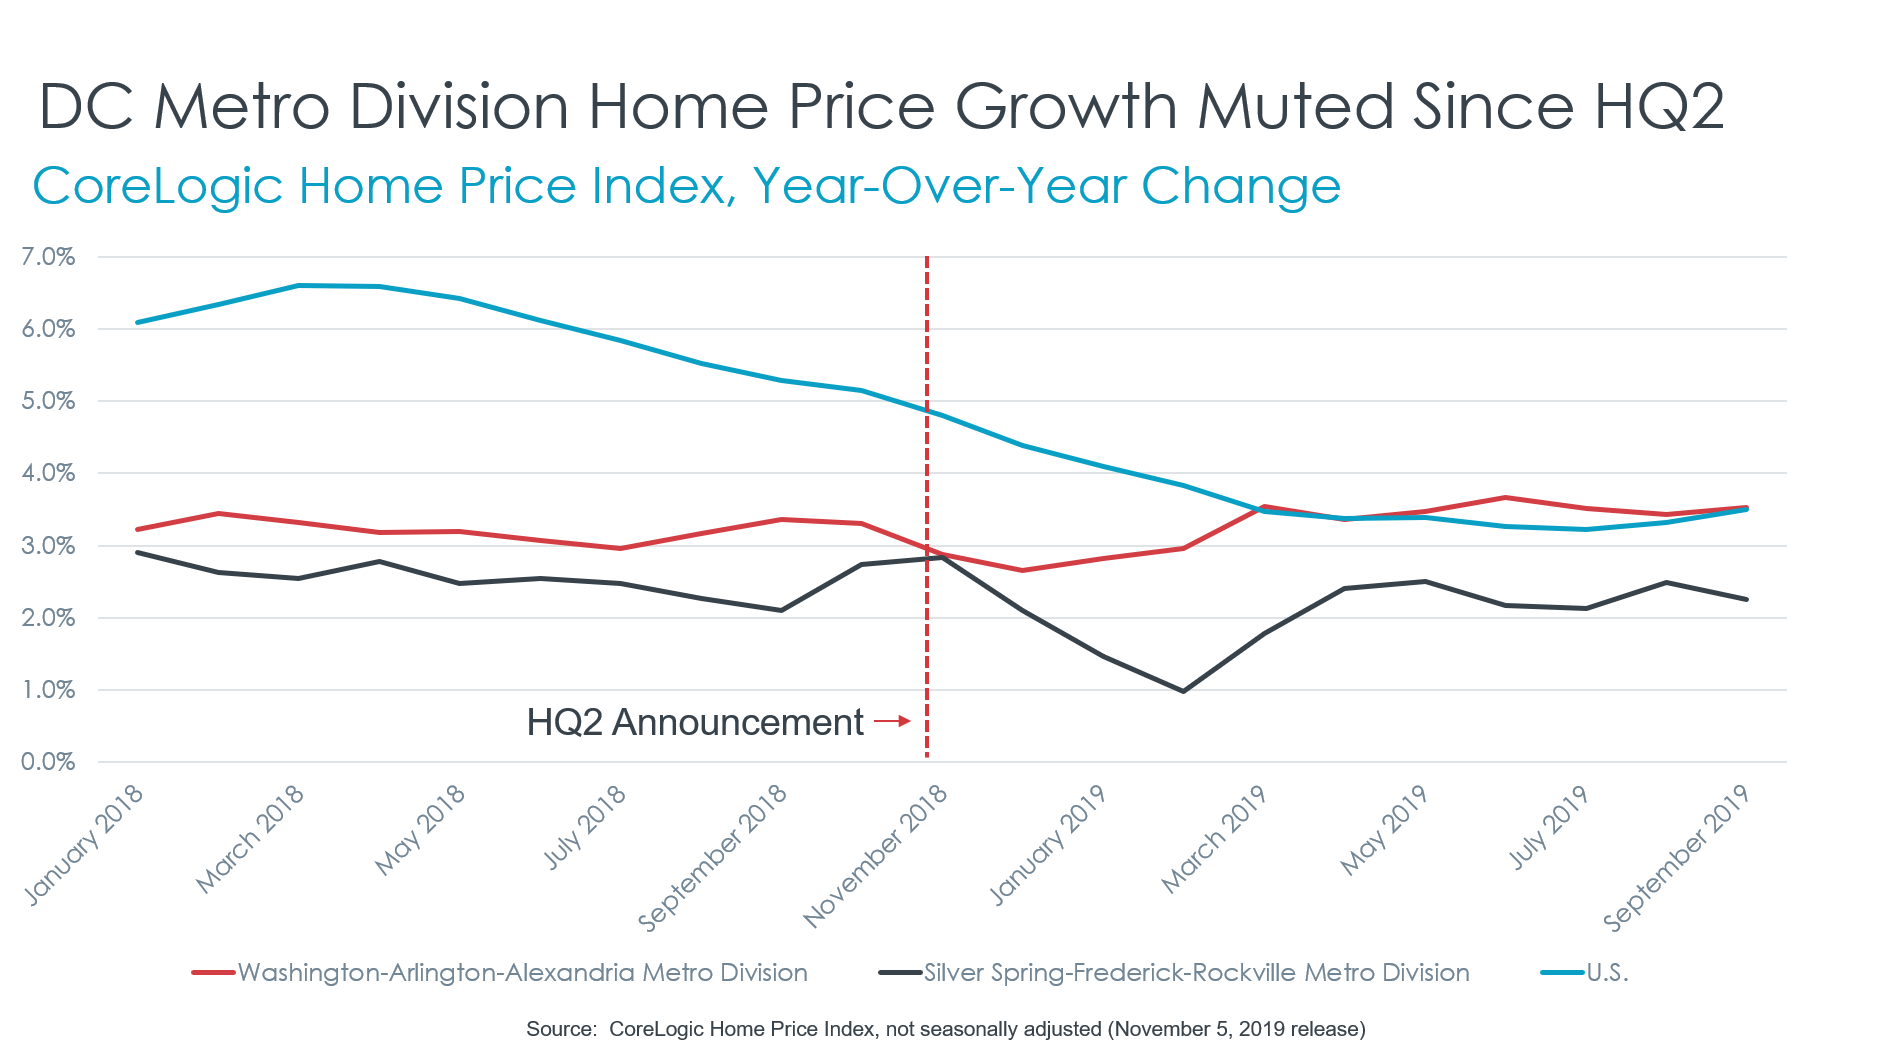
The impact of Amazon choosing the district housing market (which includes both the Washington-Arlington-Alexandria and Silver Spring-Frederick-Rockville metro divisions) for the location of their HQ2 is unclear at best. Looking at the year-over-year change in the monthly CoreLogic Home Price Index (HPI), the data shows that both metro divisions saw little change in the rate of appreciation after November 2018. In September 2018 (the most recent comparison month between 2018 and 2019), annual home price growth in the Washington-Arlington-Alexandria and Silver Spring-Frederick-Rockville metro divisions rested at 3.4% and 2.1%, respectively, but grew slightly to 3.5% and 2.3% by September 2019. This is hardly what one would call a "boom."
However, when compared to national trends over the same period, there is evidence that these two metro divisions outperformed the broader area. National home price growth descended by nearly two whole percentage points, from 5.3% to 3.5%, as high mortgage rates and uncertain macroeconomic conditions stymied the market towards the end of 2018 and into the first half 2019. While anecdotal, this does suggest that the HQ2 announcement possibly buoyed the market in what might have otherwise been a period of slowing home price growth for the Washington, D.C. metro area.
Geography Matters: Zips Near Crystal City See Sharp Increase in Price Growth
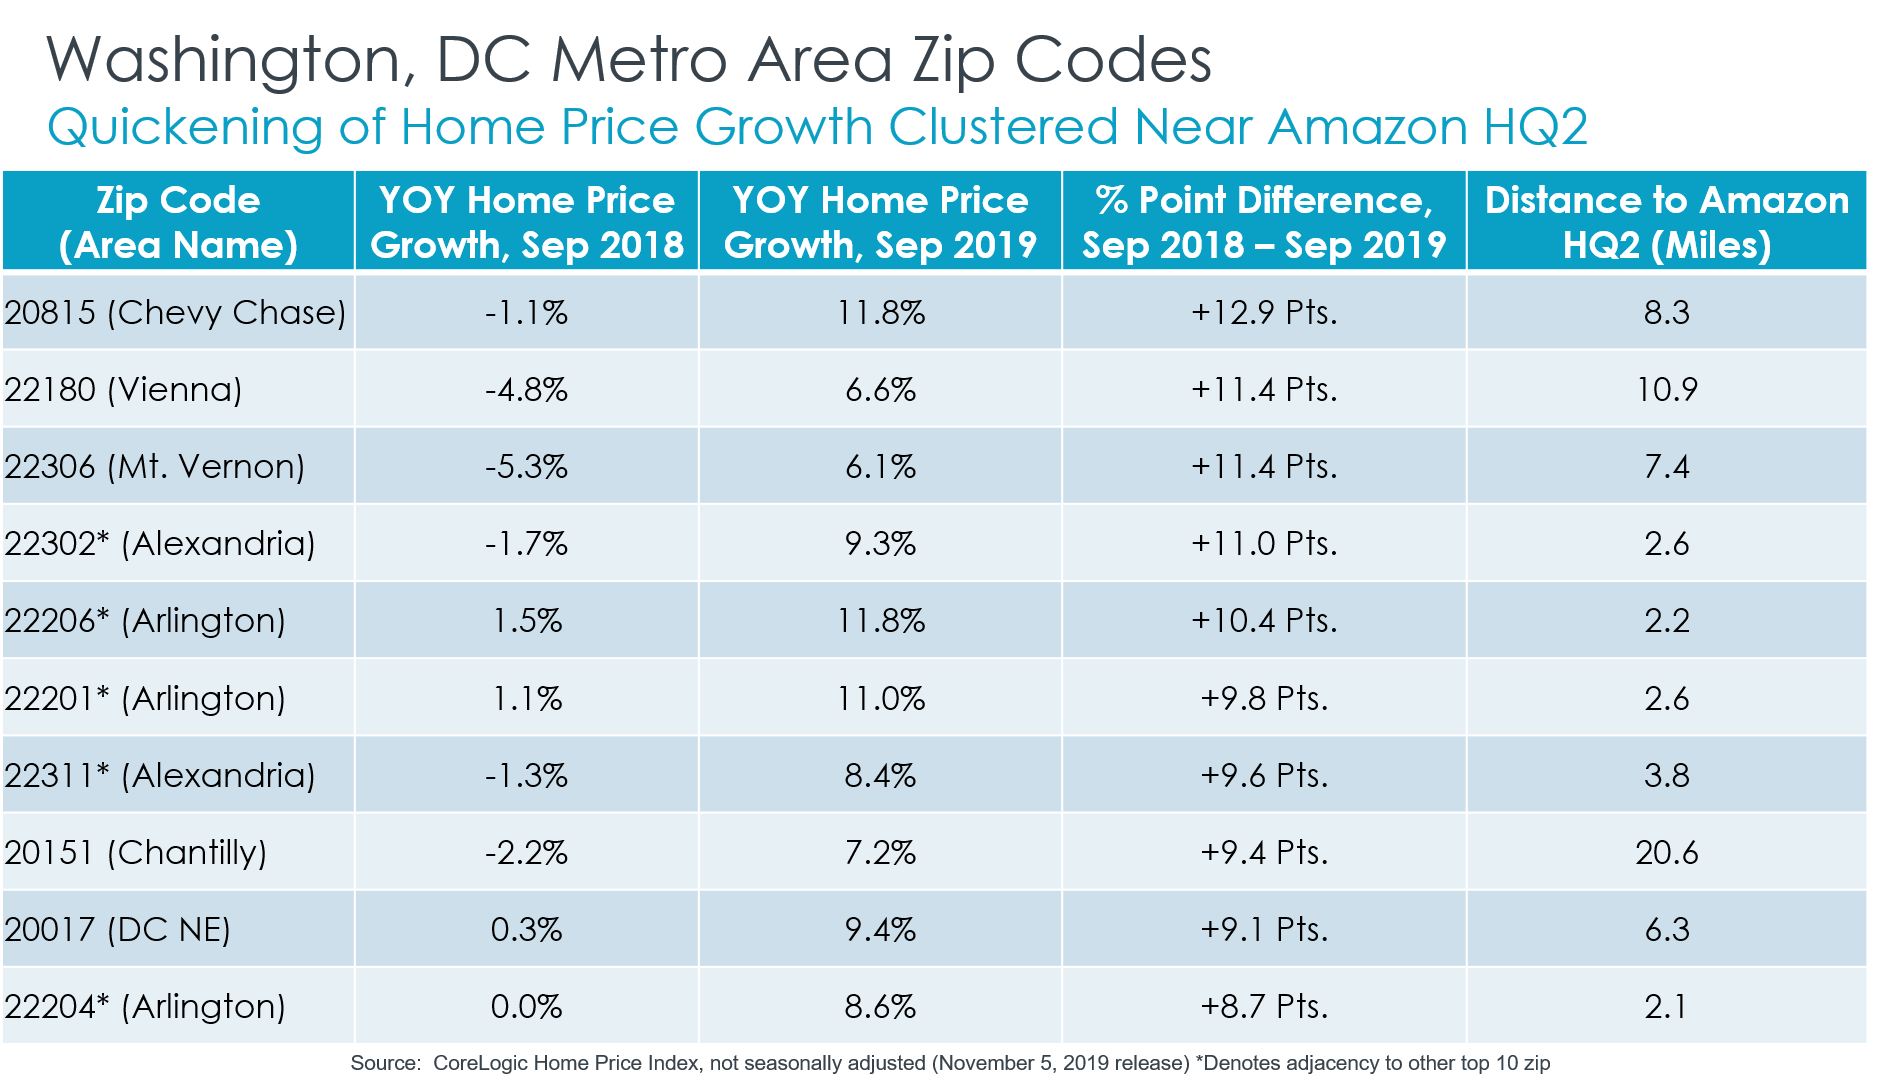
While evidence is somewhat weak that the HQ2 announcement boosted the regional market, our zip code-level analysis shows a different story. Namely, that there is a correlation between proximity to the HQ2 site and the increase of home price appreciation over the past year. Of the top 10 zip codes with the largest increase in year-over-year growth rates, half are within a 5- mile distance of the HQ2 site and eight are within 10 miles.
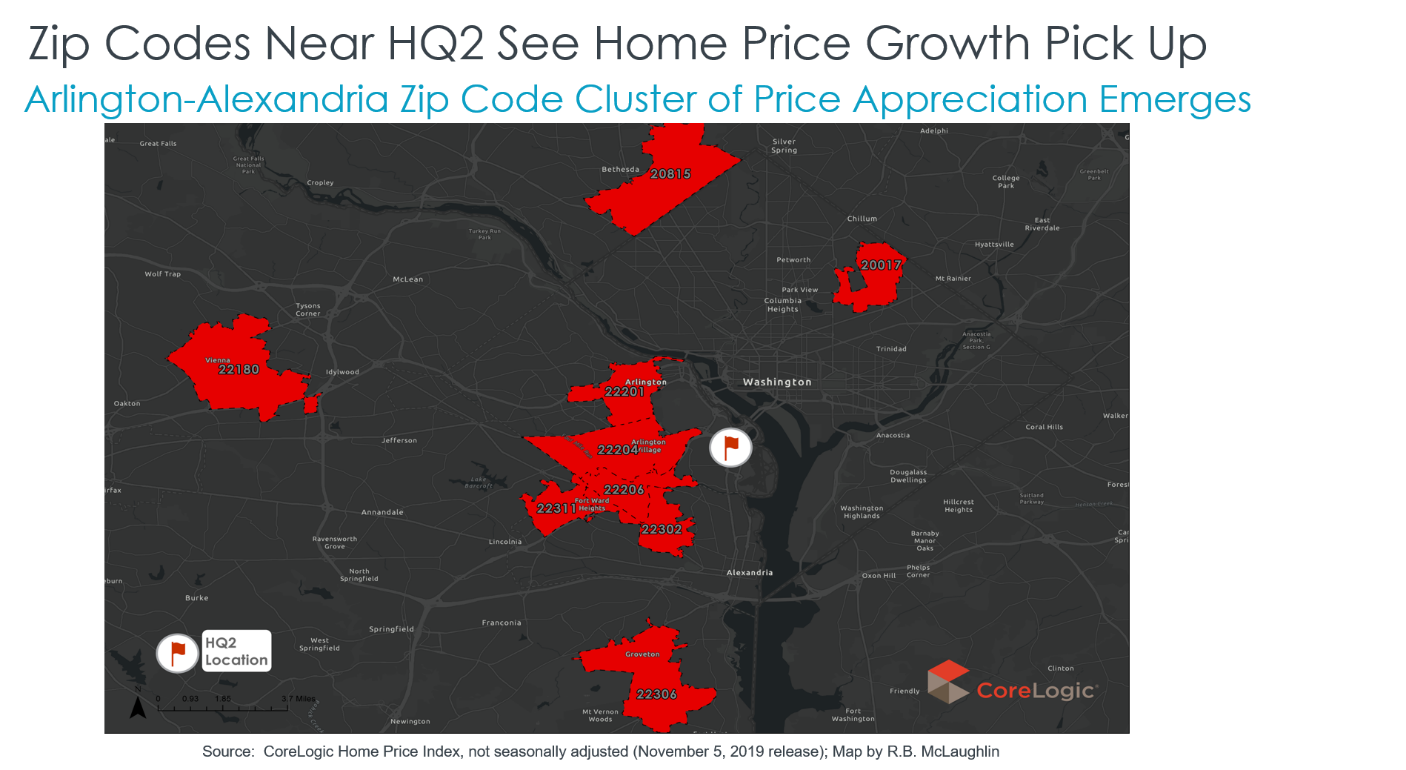
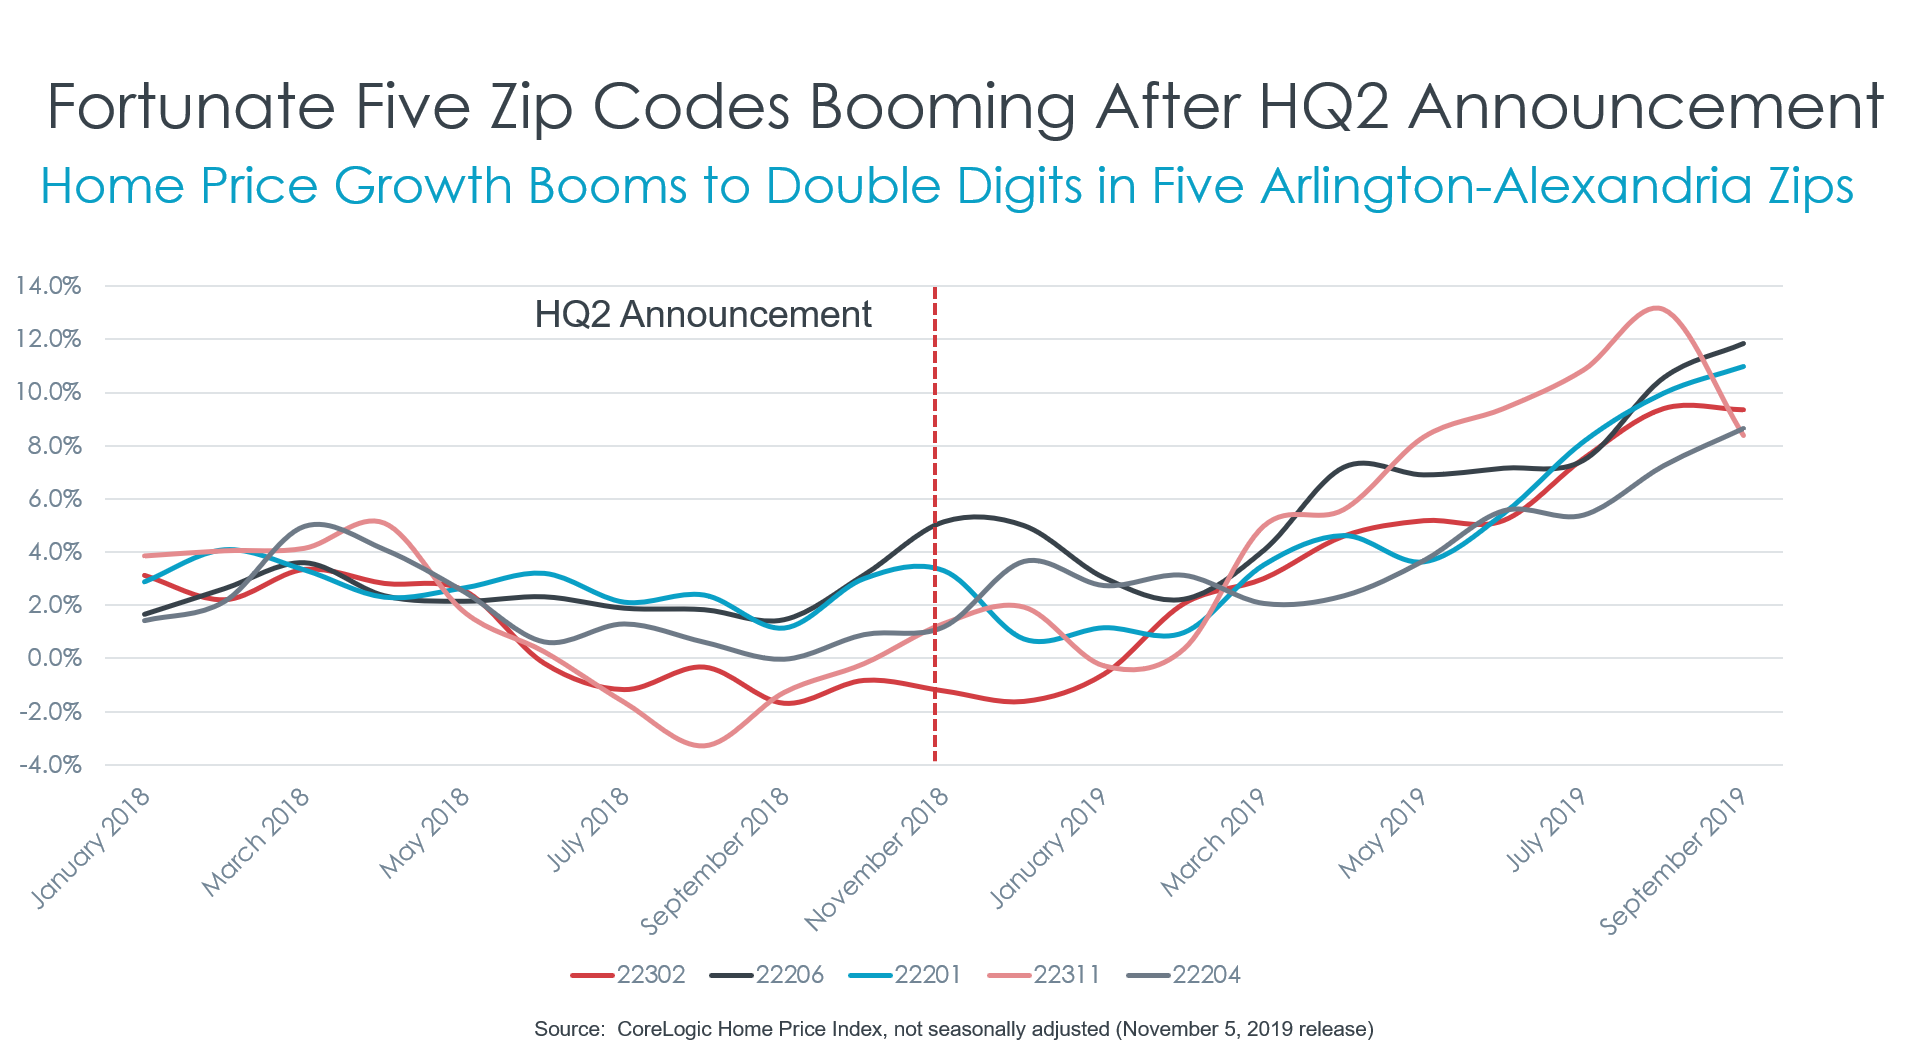
The top three zip codes with the largest increase in their September 2018 and September 2019 year-over-year growth rates are not immediately adjacent to HQ2. These zip codes are 20815 (Chevy Chase, Maryland), 22180 (Vienna, Virginia) and 22306 (Mount Vernon, Virginia). Each of these areas is at least 7 miles away from HQ2, suggesting little correlation between the HQ2 announcement and the zip codes that have picked up the most gains in home price appreciation. However, there is a cluster of zip codes in the top-10 list that are all within 4 miles of HQ2 and adjacent to one another. These include 22302 (Alexandria, Virginia), 22206 (Arlington, Virginia), 22201 (Arlington), 22311 (Alexandria) and 22204 (Arlington). Each of these has swung from having negative or near-flat price growth just before the HQ2 announcement to near double-digit appreciation in September of this year.
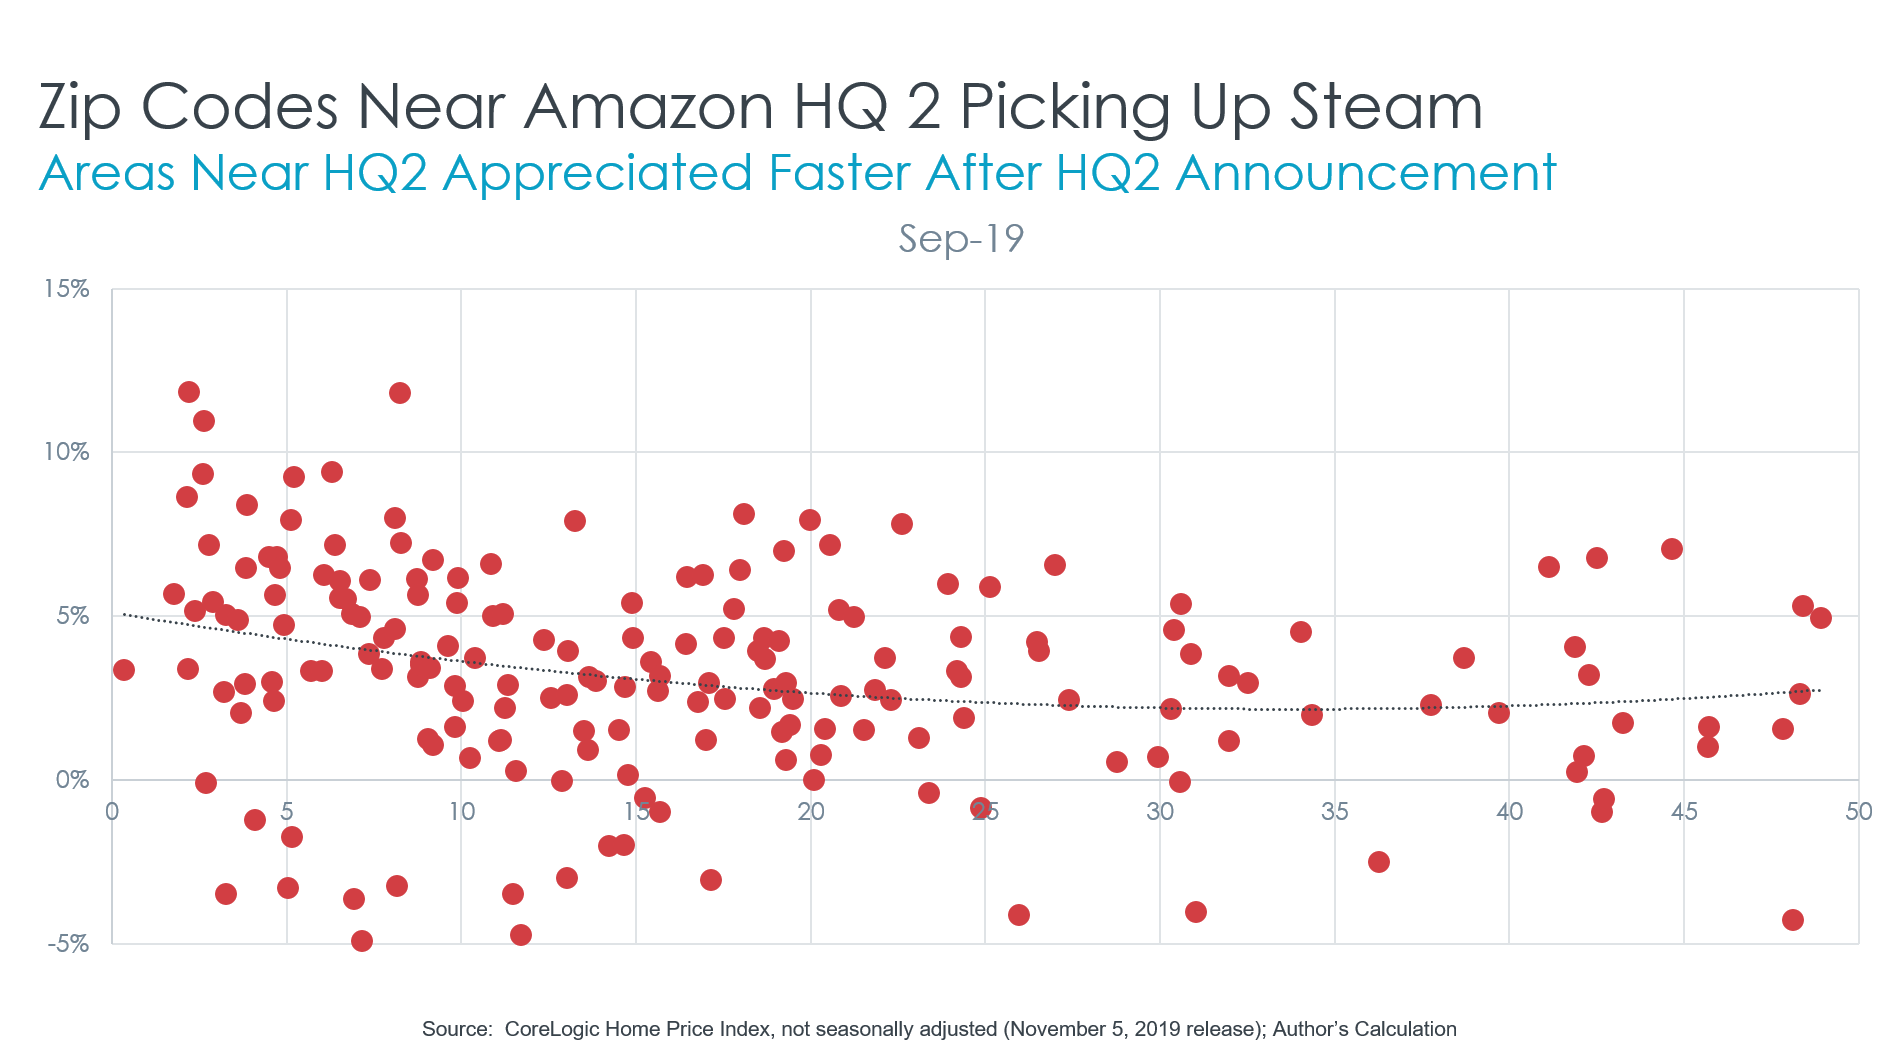
Analyzing just the top 10 zip codes isn't a big enough sample to draw meaningful conclusions about the effects of HQ2 on the Washington, D.C. housing market. So, we took our research one step further and examined the correlation between zip code proximity to the HQ2 site and year-over-year change in the CoreLogic HPI on a month-by-month basis from September 2018 to September 2019.
The correlation between a zip code's home price appreciation rate and distance in miles from the HQ2 location was flat in September 2018 and remained so through February 2019, when average zip code appreciation was about 3%. From March 2019, you can see the price gradient rise more sharply the closer to HQ2 a zip code is. By September 2019, a clear negative gradient emerges whereby appreciation in zip codes near HQ2 was, on average, much higher than zip codes near the fringe.
While not casual, the anecdotal evidence from CoreLogic does suggest the announcement of HQ is starting to show signs that house prices in Northern Virginian submarkets - in particular, those close to Crystal City - are rising at rates much faster than last year and faster than submarkets further away.
Mr. McLaughlin concludes, "While we don't know precisely how the placement of a large corporate headquarters into a region affects a housing market, our work looking back on the first year of HQ2 suggests the potential for large upward swings in home prices near the chosen site. What's more, the impact appears to take hold rather quickly, as investors and owner-occupiers bid-up home prices in anticipation of future tangible demand."
Real Estate Listings Showcase


This website uses cookies to improve user experience. By using our website you consent in accordance with our Cookie Policy. Read More