The WPJ
Residential Real Estate News


Home Flipping Activity in U.S. at 4-Year Low in 2014
RealtyTrac's Q4 and Year-End 2014 U.S. Home Flipping Report, shows that 136,269 U.S. single family homes were flipped in 2014, 5.4 percent of all single family home sales during the year -- the lowest share of flips since 2011.
A total of 32,578 U.S. single family homes were flipped in the fourth quarter, representing 5.3 percent of all single family home sales during the quarter. The 5.3 percent share of flips in the fourth quarter was up 11 percent from the previous quarter but still down 12 percent from a year ago.
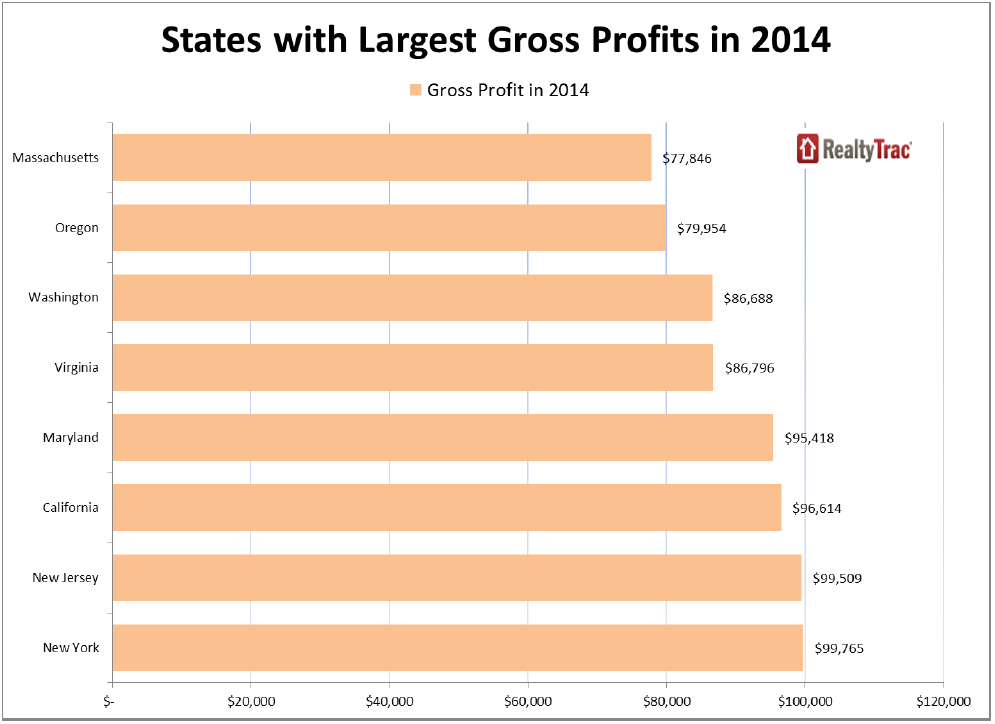
The average gross profit -- the difference between the purchase price and flipped price -- for completed flips of single family homes in the fourth quarter was $65,993, representing a 37.1 percent gross return. That was up from an average gross profit of $65,285 representing a 36.5 percent gross return in the third quarter, and an average gross profit of $63,017 representing a 36.4 percent gross return in the fourth quarter of 2013.
"Investors have picked much of the low-hanging fruit when it comes to home flipping over the past three years since home prices bottomed out in the first quarter of 2012," said Daren Blomquist, vice president at RealtyTrac. "As home price appreciation slows to single digits in most markets, flippers need to be more selective and creative about the properties and neighborhoods they target.
"In many cases the best neighborhoods for profitable flipping in a slower-appreciating market are those that come with a higher risk because of location and condition of properties, but also have a bigger upside if investors are able to correctly predict the path of progress in the region," Blomquist added. "It appears that most investors completing flips in the fourth quarter were able to do just that. Even though the share of flips was down from a year ago during the quarter, the average gross return per flip increased."
Zips with highest share of Q4 flips in Detroit, Los Angeles, Memphis, Miami
Among zip codes with at least 10 single family home flips completed in the fourth quarter of 2014, there were 10 where flips represented 25 percent or more of all single family home sales during the quarter. Metropolitan statistical areas with top 10 zip codes for share of flips in the fourth quarter were Detroit, Los Angeles, Memphis, Miami, Jacksonville, Florida, Tampa and San Diego.
Averages from the top 10 zip codes for share of flips during the fourth quarter:
- Average of 23 flips during the fourth quarter
- Average flip share of 27 percent of all single family home sales
- Average increase of 77 percent in share of flips from a year ago
- Average purchase price of $110,611
- Average gross profit of $95,700 and average gross return of 49.6 percent
Zips with highest gross return on Q4 flips in Baltimore, St. Louis, Jacksonville, Chicago
Among zip codes with at least 10 single family home flips completed in the fourth quarter of 2014, there were 10 where the average gross return on investment for flips was 120 percent or higher. Metropolitan statistical areas with top 10 zip codes for highest average returns on flips in the fourth quarter were Baltimore, St. Louis, Jacksonville, Florida, Chicago, Detroit and Washington, D.C.
Averages from these top 10 zip codes for biggest average percentage return on flips:
- Average of 17 flips during the fourth quarter
- Average flip share of 12 percent of all single family home sales
- Average increase of 3 percent in share of flips from a year ago
- Average purchase price of $66,695
- Average gross profit of $99,419 and average gross return of 150.9 percent
Zips with biggest annual increase in Q4 flips in Seattle, Atlanta, New York, Chicago, and L.A.
Among zip codes with at least 10 single family home flips completed in the fourth quarter of 2014, the top 10 with the biggest year-over-year percentage increase in the share of flips were in the following metropolitan statistical areas: Seattle, Atlanta, New York, Chicago, Los Angeles, Denver, Cincinnati, Sandusky, Ohio, and Akron, Ohio.
Averages from the top 10 zip codes for biggest annual increase in the share of flips:
- Average of 12 flips during the fourth quarter
- Average flip share of 11 percent of all single family home sales
- Average increase of 453 percent in share of flips from a year ago
- Average purchase price of $201,879
- Average gross profit of $70,360 and average gross return of 54.5 percent
Metros with highest share of fourth quarter flips
Among metropolitan statistical areas with at least 50 single family home flips in the fourth quarter, those with the highest share of flips as a percentage of total single family home sales were Miami (11.0 percent), Memphis (10.7 percent), Tampa (10.5 percent), Palm Bay-Melbourne-Titusville, Florida (10.1 percent) and Deltona-Daytona Beach-Ormond, Florida (10.0 percent).
Metros with highest gross returns on fourth quarter flips
Among metropolitan statistical areas with at least 50 single family home flips in the fourth quarter, those with the highest average gross percentage return on flips were Flint, Michigan (73.5 percent gross return), Pittsburgh (68.2 percent), Clarksville, Tennessee (67.0 percent), Baltimore (64.0 percent), and Chattanooga, Tennessee (63.4 percent).
Real Estate Listings Showcase


This website uses cookies to improve user experience. By using our website you consent in accordance with our Cookie Policy. Read More