The WPJ
Residential Real Estate News


Home Affordability in U.S. Hits 10-Year Low in 2018
Based on ATTOM Data Solutions newly released Q3 2018 U.S. Home Affordability Report, U.S. home prices in the third quarter of 2018 were at the least affordable level since Q3 2008 -- a 10-year low.
The report calculates an affordability index based on percentage of income needed to buy a median-priced home relative to historic averages, with an index above 100 indicating median home prices are more affordable than the historic average, and an index below 100 indicating median home prices are less affordable than the historic average.
Nationwide, the Q3 2018 home affordability index of 92 was down from an index of 95 in the previous quarter and an index of 102 in Q3 2017 to the lowest level since Q3 2008, when the index was 87.
Among 440 U.S. counties analyzed in the report, 344 (78 percent) posted a Q3 2018 affordability index below 100, meaning homes were less affordable than the long-term affordability averages for the county -- the highest percentage of counties below historic affordability averages since Q3 2008.
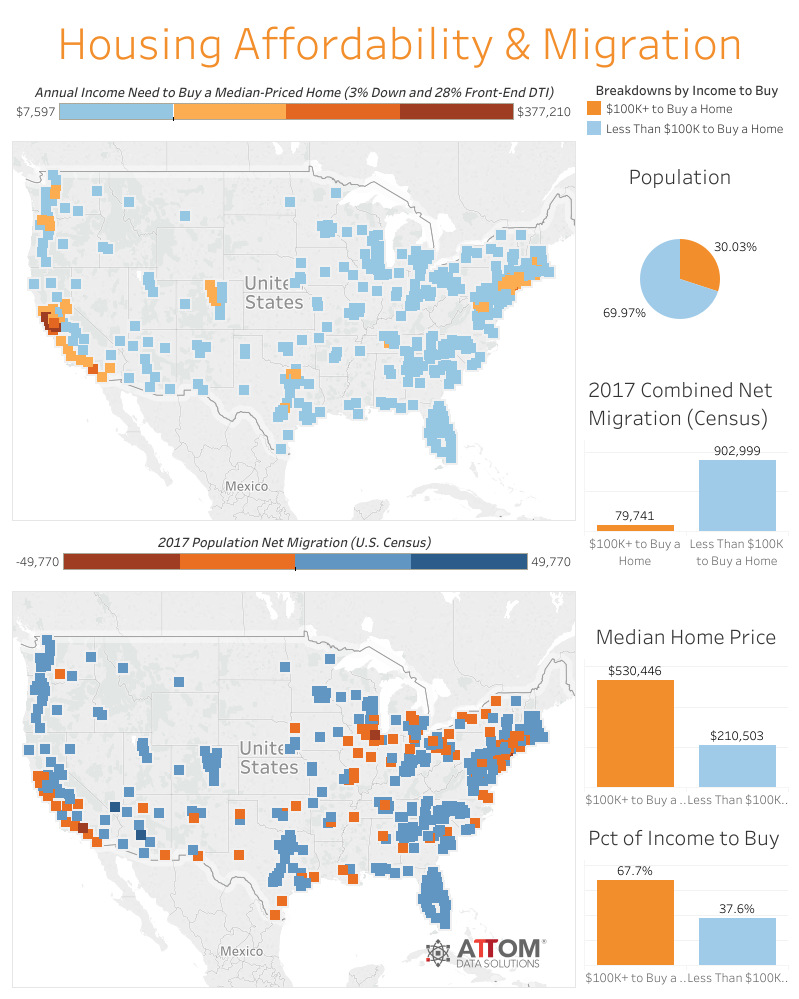
"Rising mortgage rates have pushed home prices to the least affordable level we've seen in 10 years, both nationally and at the local level," said Daren Blomquist, senior vice president at ATTOM Data Solutions. "Close to one-third of the U.S. population now lives in counties where buying a median-priced home requires at least $100,000 in annual income based on our analysis of 440 counties with a combined population of 220 million. U.S. Census net migration data shows negative net migration in more than two-thirds of those highest-priced markets, while more than three-quarters of markets requiring annual income less than $100,000 to buy a home posted positive net migration, indicating that home affordability is at least one factor driving recent migration patterns."
Home prices in 69 counties require income of $100,000 or more
Prospective homebuyers would need to make $100,000 or more to buy a median-priced home in 69 of the 440 counties analyzed in the report (16 percent), assuming a 3 percent down payment and a maximum front-end debt-to-income ratio of 28 percent (see full methodology below).
This list of 69 counties was led by the five California Bay Area counties of San Mateo ($377,210 annual income needed to buy a median-priced home), San Francisco ($366,582), Santa Clara ($327,284), Marin ($311,827), and Alameda ($237,760). Following those five California counties were Westchester County, New York ($228,937) and Kings County (Brooklyn), New York ($221,993).
Other counties where prospective homebuyers would need to make $100,000 or more to buy a median-priced home included counties in Southern California, Washington, D.C., Boston, Seattle and Hawaii.
"Several years of well-above-average home price growth has severely impacted housing affordability in the Seattle region, driven largely by our strong economy and rising incomes that have continued to cause prices to appreciate," said Matthew Gardner, chief economist with Windermere Real Estate, covering the Seattle market, where the 7 percent year-over-year home price appreciation in King County in Q3 2018 was the slowest annual appreciation in three years. "That said, I believe we have reached an inflection point and growth in home values is likely to slow until incomes can catch up."
Home prices rising faster than wages in 86 percent of local markets
Nationwide, the median home price of $250,000 in Q3 2018 was up 6 percent from a year ago, twice the annual growth of 3 percent in average wages. U.S. median home prices have increased 76 percent since bottoming out in Q1 2012 while average weekly wages have increased 17 percent over the same period. Meanwhile the average 30-year fixed mortgage rate is up 15 percent since Q1 2012 and up 17 percent just over the past year, according to the Freddie Mac Primary Mortgage Market Survey.
"As most buyers budget based on monthly payments, the median buyer is now able to bid significantly less than before," said Tendayi Kapfidze, chief economist at mortgage marketplace LendingTree, estimating that homebuyers are able to borrow 10 percent less than a year ago because of the rise in interest rates. "This means at each price point the number of buyers is falling, reducing demand. This has had immediate effects on the number of houses sold and will over time reduce the pace of home price increases. This is not cause for alarm however. Home prices have been outpacing incomes since 2012 at a pace that is unsustainable, and a period of consolidation is healthy for the housing market."
Annual home price appreciation outpaced average weekly wage growth in 378 of the 440 counties analyzed in the report (86 percent), including Los Angeles County, California; Cook County (Chicago), Illinois; Harris County (Houston), Texas; Maricopa County (Phoenix), Arizona; Miami-Dade County, Florida; and Dallas County, Texas.
Counties in Denver, Dallas, Grand Rapids least affordable relative to long-term averages
Among 128 counties with a population of 500,000 or more, those with the lowest affordability indexes -- least affordable relative to their long-term affordability averages -- were Denver County, Colorado (70); Arapahoe County, Colorado in the Denver metro area (73); Tarrant County, Texas in the Dallas-Fort Worth metro area (74); Kent County (Grand Rapids), Michigan (74); and Jefferson County, Colorado in the Denver metro area (75).
Other counties with a population of at least 500,000 and a Q3 2018 affordability index below 80 included counties in the Detroit, Michigan; Nashville, Tennessee; Atlanta, Georgia; and McAllen, Texas metro areas.
Among the 128 counties with a population of 500,000 or more, those with the highest affordability indexes -- most affordable relative to their long-term affordability averages -- were Bristol County, Massachusetts in the Providence, Rhode Island metro area (117); Suffolk County (Long Island), New York (113); Camden County, New Jersey, in the Philadelphia metro area (113); Lake County, Illinois in the Chicago metro area (111); and Jefferson County (Birmingham), Alabama (110).
Highest share of income needed to buy a home in Brooklyn
Nationwide an average wage earner would need to spend 37.0 percent of his or her income to buy a median-priced home in Q3 2018, above the historic average of 34.1 percent.
Counties with median home prices requiring the highest share of average wage earner income were Kings County (Brooklyn), New York (134.8 percent); Marin County, California in the San Francisco metro area (126.0 percent); Santa Cruz County, California (120.7 percent); San Luis Obispo County, California (100.5 percent); and Maui County, Hawaii (99.7 percent).
Counties with median home prices requiring the lowest share of average wage earner income were Clayton County, Georgia in the Atlanta metro area (15.6 percent); Wayne County (Detroit), Michigan (15.8 percent); Allen County (Lima), Ohio (16.2 percent); Saint Lawrence County, New York, in the Ogdensburg-Massena metro area (16.9 percent); and Rock Island County, Illinois in the Quad Cities metro area (18.7 percent).
Median home prices not affordable for average wage earners in 84 percent of local markets
An average wage earner would not qualify to buy a median-priced home nationwide and in 368 of the 440 counties analyzed in the report (84 percent) based on a 3 percent down payment and a maximum front-end debt-to-income ratio of 28 percent.
The report calculates an affordability index based on percentage of income needed to buy a median-priced home relative to historic averages, with an index above 100 indicating median home prices are more affordable than the historic average, and an index below 100 indicating median home prices are less affordable than the historic average.
Nationwide, the Q3 2018 home affordability index of 92 was down from an index of 95 in the previous quarter and an index of 102 in Q3 2017 to the lowest level since Q3 2008, when the index was 87.
Among 440 U.S. counties analyzed in the report, 344 (78 percent) posted a Q3 2018 affordability index below 100, meaning homes were less affordable than the long-term affordability averages for the county -- the highest percentage of counties below historic affordability averages since Q3 2008.
"Rising mortgage rates have pushed home prices to the least affordable level we've seen in 10 years, both nationally and at the local level," said Daren Blomquist, senior vice president at ATTOM Data Solutions. "Close to one-third of the U.S. population now lives in counties where buying a median-priced home requires at least $100,000 in annual income based on our analysis of 440 counties with a combined population of 220 million. U.S. Census net migration data shows negative net migration in more than two-thirds of those highest-priced markets, while more than three-quarters of markets requiring annual income less than $100,000 to buy a home posted positive net migration, indicating that home affordability is at least one factor driving recent migration patterns."
Home prices in 69 counties require income of $100,000 or more
Prospective homebuyers would need to make $100,000 or more to buy a median-priced home in 69 of the 440 counties analyzed in the report (16 percent), assuming a 3 percent down payment and a maximum front-end debt-to-income ratio of 28 percent (see full methodology below).
This list of 69 counties was led by the five California Bay Area counties of San Mateo ($377,210 annual income needed to buy a median-priced home), San Francisco ($366,582), Santa Clara ($327,284), Marin ($311,827), and Alameda ($237,760). Following those five California counties were Westchester County, New York ($228,937) and Kings County (Brooklyn), New York ($221,993).
Other counties where prospective homebuyers would need to make $100,000 or more to buy a median-priced home included counties in Southern California, Washington, D.C., Boston, Seattle and Hawaii.
"Several years of well-above-average home price growth has severely impacted housing affordability in the Seattle region, driven largely by our strong economy and rising incomes that have continued to cause prices to appreciate," said Matthew Gardner, chief economist with Windermere Real Estate, covering the Seattle market, where the 7 percent year-over-year home price appreciation in King County in Q3 2018 was the slowest annual appreciation in three years. "That said, I believe we have reached an inflection point and growth in home values is likely to slow until incomes can catch up."
Home prices rising faster than wages in 86 percent of local markets
Nationwide, the median home price of $250,000 in Q3 2018 was up 6 percent from a year ago, twice the annual growth of 3 percent in average wages. U.S. median home prices have increased 76 percent since bottoming out in Q1 2012 while average weekly wages have increased 17 percent over the same period. Meanwhile the average 30-year fixed mortgage rate is up 15 percent since Q1 2012 and up 17 percent just over the past year, according to the Freddie Mac Primary Mortgage Market Survey.
"As most buyers budget based on monthly payments, the median buyer is now able to bid significantly less than before," said Tendayi Kapfidze, chief economist at mortgage marketplace LendingTree, estimating that homebuyers are able to borrow 10 percent less than a year ago because of the rise in interest rates. "This means at each price point the number of buyers is falling, reducing demand. This has had immediate effects on the number of houses sold and will over time reduce the pace of home price increases. This is not cause for alarm however. Home prices have been outpacing incomes since 2012 at a pace that is unsustainable, and a period of consolidation is healthy for the housing market."
Annual home price appreciation outpaced average weekly wage growth in 378 of the 440 counties analyzed in the report (86 percent), including Los Angeles County, California; Cook County (Chicago), Illinois; Harris County (Houston), Texas; Maricopa County (Phoenix), Arizona; Miami-Dade County, Florida; and Dallas County, Texas.
Counties in Denver, Dallas, Grand Rapids least affordable relative to long-term averages
Among 128 counties with a population of 500,000 or more, those with the lowest affordability indexes -- least affordable relative to their long-term affordability averages -- were Denver County, Colorado (70); Arapahoe County, Colorado in the Denver metro area (73); Tarrant County, Texas in the Dallas-Fort Worth metro area (74); Kent County (Grand Rapids), Michigan (74); and Jefferson County, Colorado in the Denver metro area (75).
Other counties with a population of at least 500,000 and a Q3 2018 affordability index below 80 included counties in the Detroit, Michigan; Nashville, Tennessee; Atlanta, Georgia; and McAllen, Texas metro areas.
Among the 128 counties with a population of 500,000 or more, those with the highest affordability indexes -- most affordable relative to their long-term affordability averages -- were Bristol County, Massachusetts in the Providence, Rhode Island metro area (117); Suffolk County (Long Island), New York (113); Camden County, New Jersey, in the Philadelphia metro area (113); Lake County, Illinois in the Chicago metro area (111); and Jefferson County (Birmingham), Alabama (110).
Highest share of income needed to buy a home in Brooklyn
Nationwide an average wage earner would need to spend 37.0 percent of his or her income to buy a median-priced home in Q3 2018, above the historic average of 34.1 percent.
Counties with median home prices requiring the highest share of average wage earner income were Kings County (Brooklyn), New York (134.8 percent); Marin County, California in the San Francisco metro area (126.0 percent); Santa Cruz County, California (120.7 percent); San Luis Obispo County, California (100.5 percent); and Maui County, Hawaii (99.7 percent).
Counties with median home prices requiring the lowest share of average wage earner income were Clayton County, Georgia in the Atlanta metro area (15.6 percent); Wayne County (Detroit), Michigan (15.8 percent); Allen County (Lima), Ohio (16.2 percent); Saint Lawrence County, New York, in the Ogdensburg-Massena metro area (16.9 percent); and Rock Island County, Illinois in the Quad Cities metro area (18.7 percent).
Median home prices not affordable for average wage earners in 84 percent of local markets
An average wage earner would not qualify to buy a median-priced home nationwide and in 368 of the 440 counties analyzed in the report (84 percent) based on a 3 percent down payment and a maximum front-end debt-to-income ratio of 28 percent.
Real Estate Listings Showcase


This website uses cookies to improve user experience. By using our website you consent in accordance with our Cookie Policy. Read More