The WPJ
Commercial Real Estate News


Global Office Rent Index Rose 5% in 2011, Office Capital Value Index Rose 8%
According to CBRE's latest Global Office Rent and Global Capital Value Indices, both held steady in Q4 2011, increasing by only 0.48% and 0.44%, respectively. Compared with year-end 2010, the indices measured increases of 5.0% for Global Rent and 8.2% for Global Capital, reflecting stronger growth in the first half of 2011.
"After a good start in 2011, global office rental rates and capital value recoveries were delayed in the fourth quarter by the dominant global macro-economic issues," said Dr. Raymond Torto, CBRE Global Chief Economist. "We believe the recoveries in commercial real estate are only delayed not denied, as new construction pipelines are sparse except in a select number of markets."
The uncertain global economic backdrop continued to contribute to occupier and investor caution, thus diminishing the strength of the global office commercial real estate recovery. While both global indices continued to edge upward slightly, the quarterly growth rates were notably below the rates previously seen in the first half of 2011.
- For example, since the CBRE Global Office Rent Index began increasing in Q2 2010; the average quarterly growth rate through Q3 2011 was 1.2%.
- Similarly, the CBRE Global Office Capital Value Index reached bottom in Q4 2009, and its quarterly average growth rate through Q3 2011 was 2.2%.
- Both the Global Capital Value Index and Global Rent Index are 10% below their pre-recession peaks.
Global Office Rent Index Regional Breakdown
-
 Thanks to slight gains in the office-using employment sector in the U.S., a moderate resurgence in demand has gradually reinvigorated the Americas Rent Index, which increased 0.95% this quarter, making this the strongest quarterly gain for all three global regions. However, in order for the Americas Index to return to pre-recession rent levels, employment across all economic sectors must noticeably improve.
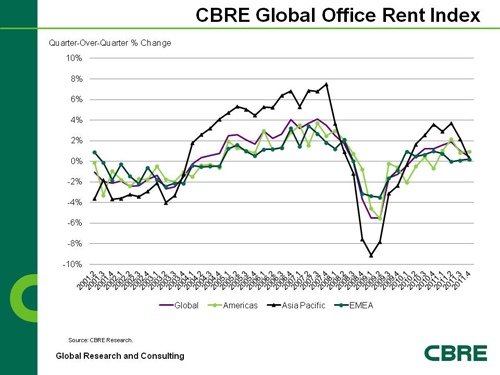
- While the Asia Pacific Rent Index rose 2.8% on average over the past six quarters, it edged up only 0.27% in Q4 2011. Despite having experienced the relatively strongest rental recovery, the region currently stands the farthest below its pre-recession peak.
- EMEA's Rent Index inched up 0.19% in Q4 2011. The uncertainty surrounding the European Sovereign Debt Crisis has contributed to occupier caution. Remarkably, though, EMEA's Rent levels fell the least and stand the closest of all regions to reaching pre-recession levels.
Global Capital Value Index Regional Breakdown
-
 From Q2 2010 through Q2 2011, the Asia Pacific region was responsible for boosting the Global Capital Value Index and led all three global regions with the highest quarterly growth rates. This quarter, however, the Americas Capital Value Index contributed most strongly with a 2.0% quarterly increase, while Asia Pacific and EMEA saw quarterly declines of 0.6% and 0.04%, respectively.
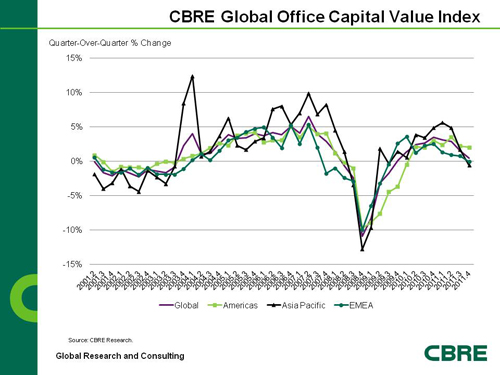
- However, the Americas index level remains the lowest of all regions relative to its pre-recession levels.
- In contrast, having undergone the largest recovery from its trough, Asia Pacific's current index level is only 0.7% below its pre-recession peak level, even despite tempered growth over the past two quarters.
- Meanwhile, since emerging from its trough in Q3 2009, EMEA's Capital Value Index has gradually recovered; increasing by 16.3% from its trough. It still hovers 13.1% below its cyclic peak recorded in Q3 2007.
The CBRE Indices were created by CBRE Research. The Global Office Rent Index is comprised of data from 123 cities around the world. The Global Capital Value Index uses the same sample for EMEA and Asia Pacific, while the Americas data is derived from the National Council of Real Estate Investment Fiduciaries (NCREIF) and is not built up city by city the same way as is the rent index data. The base period for the indices is Q1 2001.
Real Estate Listings Showcase


This website uses cookies to improve user experience. By using our website you consent in accordance with our Cookie Policy. Read More