The WPJ
Commercial Real Estate News


Manhattan Office Market Improves in July; Liquidity Increases in CMBS Market Despite Debt Ceiling Drama
According to a new report by Jones Lang LaSalle, the Manhattan office markets continue to improve with declining vacancies in most sub-markets, and rising rents.
Midtown Manhattan
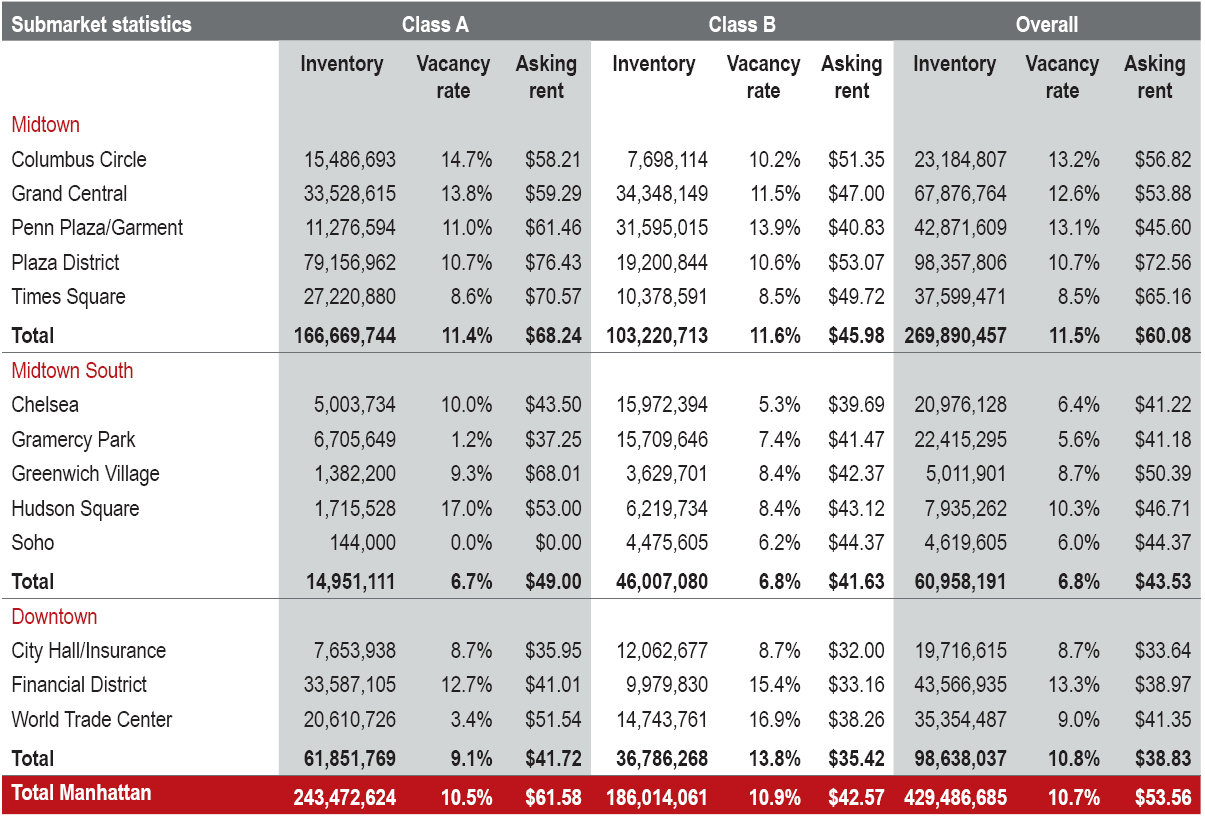
Class A vacancy in Midtown continued on a downward trend in July, finishing the month at 11.4 percent down from 11.7 percent in June. Vacancy for Class A space has declined for four consecutive months. Leasing activity managed to outpace space being returned to the market. The largest new leases during the month were Arts & Entertainment (A&E) lease of 149,000 square feet at 685 Third Avenue and Alvarez and Marsal's sublease of 102,917 square feet at 600 Madison Avenue. The space was formerly occupied by Tiffany & Company.
As vacancy declined average asking rents moved higher. Class A rates have crossed the $68.00 per square foot mark, the highest they've been in nearly two years. Since the trough in second quarter 2010 average asking rents for Class A space are up by more than 6.0 percent. In the Plaza District prime rents have risen past the $75.00 per square foot mark, finishing at $76.43 per square foot.
Midtown South Manhattan
After declining steadily for the last five months, Midtown South's Class A vacancy rate rose in July, finishing at 6.7 percent. Despite the increase Midtown South remains one of the tightest markets in the U.S. Hudson Square achieved the highest Class A vacancy rate at 17.0 percent due mainly to space at 330 Hudson Street.
Average asking rents rose to $49.00 per square foot for Class A space, up from $48.86 in June. Pricing is the highest in the Greenwich Village area at $68.01 per square foot, rivaling the Times Square submarket in Midtown. Asking rents above market at 450 West 14th Street are the main reason for the escalated rents.
Downtown Manhattan
Downtown's overall vacancy rate decreased during July, down to 10.8 percent from 11.3 percent in June. Oppenheimer & Company's lease of 270,000 square feet at 85 Broad Street contributed largely to the decline. The lease also resulted in a decrease in Class A vacancy, which dropped to 9.1 percent. While the market has shown some improvement, it is widely expected that vacancy in the Downtown market will rise considerably over the next 12-24 months.
In July Class A average asking rents rose slightly, up to $41.72 per square foot from $41.66 in June. The rise in rates is more of a function of the mix of space on the market than across the board rate increases. Class A asking rates range from $35.95 in the City Hall/Insurance submarket to a high of $51.54 per square foot in the World Trade Center area.
Capital Markets
The U.S. experienced an exceptionally strong first half of 2011 in total sales volume. Sales through June 2011 totaled $82.7 billion, up 116 percent over the same period in 2010. All property sectors experienced robust growth thanks to increased debt availability and a hunger among investors for yield options in a low interest rate environment. While investors have broadened their geographic search for quality assets in secondary markets as well as less prime locations in leading gateway markets, their activity still heavily favors centrally-located core office investment in leading markets, most notably New York and Washington, DC. As the second half of 2011 unfolds, it is probable that the recovery in the capital markets for institutional-quality office properties will continue to incrementally expand to additional markets and product sub-types, as the U.S. remains on schedule for a significant expansion in investment sales volume for the full year.
Liquidity in the U.S. commercial real estate debt markets continues to increase despite the recent fiasco caused by S&P in the CMBS market. Through July 2011, total CMBS issuance was $19.6 billion compared to $10.9 billion in all of 2010. Total issuance for the year is expected to reach $40 billion. The biggest news in the real estate debt markets was S&P's announcement on July 28 that it is undertaking a model review, and would not rate CMBS deals that were expected to close imminently. This forced one issuer, Goldman Sachs, to scrap its entire $1.5 billion offering which S&P had blessed just before announcing it was pulling its ratings. The timing of the announcement was unfortunate as it called into question the credibility of the rating agencies, especially S&P, just as the CMBS market was starting to gain strong momentum.
Fortunately there are numerous rating agencies and new issuance should continue, albeit without S&P in the near term. The biggest winner as a result of S&P's troubles is Moody's as many institutional investors are limited to buying bonds with either a Moody's or S&P rating and Moody's will now pick up the deals that were going to go S&P's way.
Real Estate Listings Showcase


This website uses cookies to improve user experience. By using our website you consent in accordance with our Cookie Policy. Read More