The WPJ
Commercial Real Estate News


London Retains Title of Most Expensive Office Market
According to CBRE's latest Global Prime Office Occupancy Costs survey, London's West End remained the world's highest-priced office market, but Asia continued to dominate the world's most expensive office locations, accounting for three of the top five markets.
The study also found that rents are rising fastest in the Americas, where real estate fundamentals continue to improve significantly. Overall, the U.S. accounted for five of the 10 markets with the fastest growing occupancy costs. These markets were Seattle (Suburban), San Francisco (Downtown), San Francisco (Peninsula), Houston (Suburban) and Houston (Downtown).
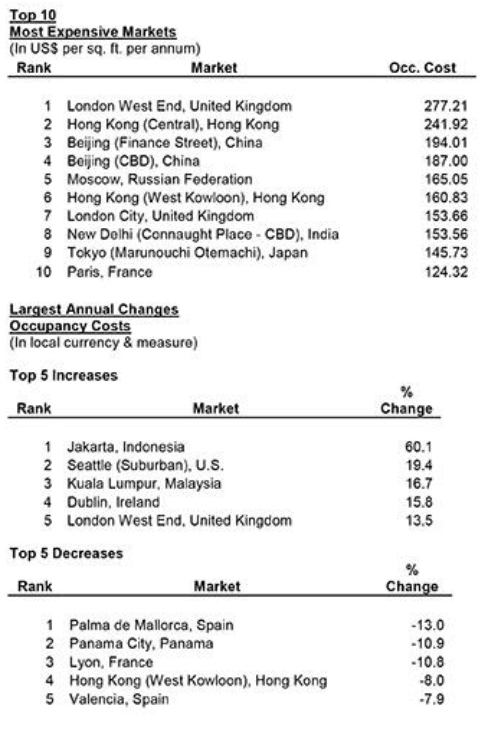
London West End's overall occupancy costs of US$277 per sq. ft. per year topped the "most expensive" list. Hong Kong (Central) followed with total occupancy costs of US$242 per sq. ft. Beijing (Finance Street) (US$194 per sq. ft.), Beijing (Central Business District (CBD)) (US$187 per sq. ft.) and Moscow (US$165 per sq. ft.) rounded out the top five.
 Global prime office occupancy costs rose 2.3% year-over-year, led by the Americas (up 3.3%) and Asia Pacific (up 2.9%). Meanwhile, EMEA was essentially flat, edging down 0.1% year-over-year. The regional results are consistent with recent economic trends, in that the American economy has been stronger than EMEA's over the past year. While Asia Pacific exhibited the highest economic growth of the three regions, it also has a large pipeline of office projects, which is beginning to put downward pressure on costs in key markets.
"We believe that occupancy costs are poised to accelerate in the latter part of 2014. Even though occupiers remain cost conscious, demand for prime office space is continuing to increase," said Dr. Raymond Torto, Global Chairman, CBRE Research. "With the exception of a few markets, mostly in Asia Pacific, there is not a sufficient volume of new construction to meet demand. As such, market rents for prime properties are expected to continue rising, which, coupled with the higher cost of operating office buildings, will push up occupancy costs in most markets in the coming months."
CBRE tracks occupancy costs for prime office space in 126 markets around the globe. Of the top 50 "most expensive" markets, 21 were in EMEA, 20 were in Asia Pacific and 9 were in the Americas.
Occupancy cost comparisons in U.S. dollars are affected by currency exchange rates. However, the annual percent change in occupancy costs are in local currency and are not influenced by currency changes (except Jakarta, Indonesia where leases are typically written in U.S. dollars, but paid in rupiah, which means the occupancy cost increase is greatly affected by the currency depreciation in Indonesia).
Europe Middle East & Africa (EMEA)
EMEA was home to the world's most expensive market, with London West End at US$277 per sq. ft. per annum. Development restrictions in the West End keep vacancy rates comparatively very low. The improvement in the U.K. economy has triggered a strong recovery in the demand for space. This demand, along with the shortage of available space, has been putting upward pressure on prime rents throughout 2013 and into 2014.
Other markets from the region in the list's top 10 are Moscow (US$165 per sq. ft.), London City (US$154 per sq. ft.) and Paris (US$124 per sq. ft.).
Both Palma de Mallorca, Spain, and Lyon, France, posted double-digit decreases in prime occupancy costs, falling 13.0% and 10.8%, respectively, over the past 12 months, a reflection of the effects of the lingering Eurozone crisis.
Asia Pacific
Asia-Pacific had 20 markets ranked in the top 50 most expensive, including six of the top 10-- Hong Kong (Central), Beijing (Finance Street), Beijing (CBD), Hong Kong (West Kowloon), New Delhi (Connaught Place - CBD) and Tokyo (Marunouchi Otemachi).
Hong Kong (Central) remained the only market in the world other than London's West End with an occupancy cost exceeding $200 per sq. ft. per annum. Hong Kong (West Kowloon) dropped one spot to sixth place amid an 8.0% decrease in occupancy costs due to the addition of new office space at a time that occupiers are moving cautiously in the market. However, occupancy costs in both markets are anticipated to start increasing in the coming months.
West Kowloon, just 10 minutes away via subway from Central, is already home to big investment banks and has emerged as an attractive location for cost-conscious occupiers looking for quality space near the central business district. Leasing activity in West Kowloon had slowed down in the past year, but demand for smaller space picked up considerably after the Chinese New Year, although the market's low vacancy level has made it difficult for larger occupiers to find suitable space options.
The most expensive market in the global ranking from the Pacific Region was Sydney (US$106 per sq. ft. per annum), which came in at 17th place.
The Americas
High-tech- and energy-related businesses in markets such as Seattle (Suburban), San Francisco (Downtown), San Francisco (Peninsula), Houston (Suburban) and Houston (Downtown) reported some of the strongest annual prime office occupancy gains, with Seattle (Suburban) posting a significant 19.4% annual increase in occupancy costs. Rents in these markets have increased as a result of extremely tight market conditions, as strong demand from technology and energy tenants, combined with low vacancy rates, has given landlords leeway to increase rents significantly.
The Americas was again led by New York Midtown, which posted a prime office occupancy cost of US$121 per sq. ft., which ranked as the 11th most expensive market in the world.
Rio de Janeiro remained the most expensive market in Latin America, posting an office occupancy cost of US$110 per sq. ft. and ranking as the 13th most expensive market globally.
Real Estate Listings Showcase


This website uses cookies to improve user experience. By using our website you consent in accordance with our Cookie Policy. Read More