The WPJ
Residential Real Estate News


U.S. Housing Market Beginning to Tip Away from Extremely Favorable Affordability Climate
Based on RealtyTrac's latest U.S. housing report, affordability for buying a residential property across hundreds of U.S. counties has surpassed historical averages for income-to-price affordability percentages since 2000 - making them less affordable now than they have been on average over the last 14 years.
The report calculated both the percentage of median income needed to make monthly payments on a median-priced home in each county in May 2014 as well as the historical trend in each county's income-to-price affordability percentage going back to January 2000. It also analyzed the impact of rising interest rates on affordability, calculating the percentage of median income needed to make payments on a median-priced home if interest rates rise by a quarter percentage point, a half percentage point, three-quarters of a percentage point or a full percentage point.
"The good news is that none of the nearly 1,200 counties we analyzed for the second quarter has regressed to the dangerously low affordability levels reached during the housing price bubble, and even if interest rates increased 1 percentage point, only 59 counties representing 2 percent of the U.S. population would be at or above bubble levels in terms of affordability," said Daren Blomquist, vice president at RealtyTrac. "But the scales are beginning to tip away from the extremely favorable affordability climate we've seen over the last two years, with one-third of the counties analyzed -- representing 19 percent of the total population in those counties -- now less affordable than their long-term averages.
"Still, 81 percent of the U.S. population lives in markets where the percentage of income needed to purchase a median-priced home is at or below its long-term average," Blomquist continued. "Buyers looking for markets with a combination of affordable housing and a good job climate will find those mostly in the middle of the country, in places such as Columbus, Ohio, Oklahoma City, Omaha, Des Moines and Minneapolis, all of which have counties where 20 percent or less of the median income is needed to buy a median-priced home and where unemployment rates are 5 percent or lower."
Second quarter affordability highlights
Of the 1,194 counties with data in the second quarter (combined population of 258 million), the average percentage of median income needed to buy a median priced home was 19.07 percent.
Of the 1,194 counties with data, 793 counties with a combined population of 210 million (81 percent of total population) had an income-to-price affordability percentage that was below the historical average for that county -- meaning the county was more affordable for buyers than it has been on average over the past 14 years.
Counties still more affordable than their long-term averages in the second quarter included Los Angeles County (by less than a half a percentage point), Cook County, Ill. (Chicago), Maricopa County, Ariz. (Phoenix metro), San Diego and Orange counties in Southern California, Miami-Dade County in South Florida, and the New York City boroughs of Kings County (Brooklyn) and Queens County.
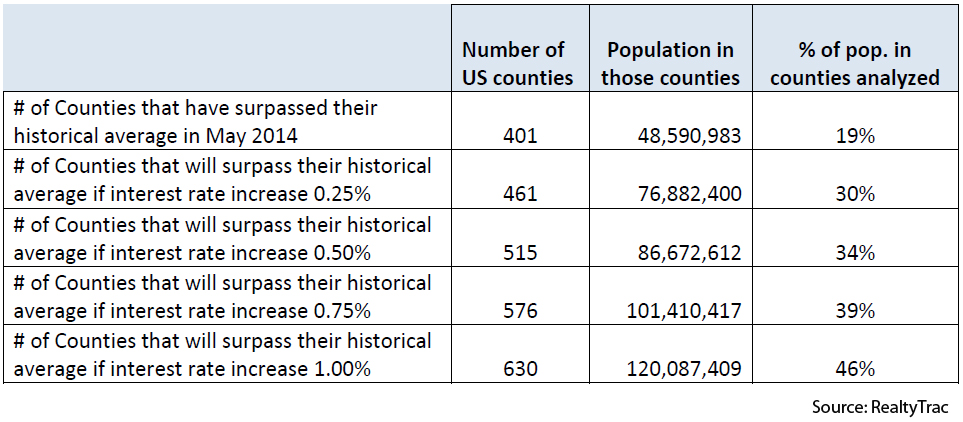
Meanwhile, 401 counties with a combined population of 49 million (19 percent of total population) had an income-to-price affordability percentage above the historical averages for that county-- meaning the county was less affordable for buyers than it has been on average over the past 14 years.
Counties less affordable than their long-term averages included San Francisco County, Calif., Multnomah County, Ore. (Portland), Travis County, Texas (Austin), Bexar County, Texas (San Antonio), Harris County, Texas (Houston) and Fulton County, Ga. (Atlanta).
Inherently unaffordable markets
Of the 2,268 counties with historical affordability data (combined population 305 million), the historical average percentage of median income needed to buy a median priced home was 18.77 percent.
Of those 2,268 total counties, there were 23 counties with a combined population of 21 million (7 percent of total population) with an average historical income-to-price affordability percentage of 50 percent or higher.
Counties in this inherently unaffordable category included vacation home markets like Nantucket County, Mass. (111 percent), Teton County, Wyoming (84 percent), and Pitkin County, Colo. (82 percent) along with four out of the five boroughs in New York City, and San Francisco County (85 percent), and Los Angeles County (50 percent) in California.
Consistently affordable markets
On the other end of the spectrum, there were 831 counties with a combined population of 44 million (14 percent of the total population of the 2,268 counties with historical affordability data) with an average historical income-to-price affordability percentage of 15 percent or less.
Counties in this consistently affordable category included Wayne County, Mich., in the Detroit metro area (13 percent of median income needed to buy a median priced home on average since January 2000), Marion County, Ind., in the Indianapolis metro area (14 percent), Monroe County, N.Y., in the Rochester metro area (12 percent), Baltimore City, Md., (14 percent), and Montgomery County, Ohio, in the Dayton metro area (14 percent).
Affordable with jobs markets
The report also looked at markets with the favorable combination of low income-to-price affordability percentages and low unemployment rates. Among counties with a population of 100,000 or more, there were 66 counties with a combined population of 16 million where the average historical income-to-price affordability percentage was 20 percent or below, where the May 2014 unemployment rate was 5 percent or lower and where the May 2014 income-to-price affordability percentage was below the historical average.
Counties in this affordable-with-jobs markets category included Franklin County, Ohio (Columbus), Oklahoma County, Okla., (Oklahoma City), Tulsa County, Okla., (Tulsa), Summit County, Ohio (Akron), Douglas County, Neb., (Omaha), Greenville County, S.C. (Greenville), and Polk County, Ia., (Des Moines).
Impact of rising interest rates on affordability
The report analyzed the income-to-price affordability percentages in each of the 1,194 counties with data available in the second quarter if median prices remained the same as they were in the second quarter but interest rates rose by a quarter percentage point, a half a percentage point, three-quarters a percentage point or a full percentage point.
If interest rates rise a quarter percentage point, 461 counties with a combined population of 77 million (30 percent of total population) will exceed their historical average for income-to-price affordability percentage, and 27 counties with a combined population of 2.8 million (1.1 percent of total population) will exceed their historical peaks for income-to-price affordability percentage.
If interest rates rise a half a percentage point, 515 counties with a combined population of 87 million (34 percent of total population) will exceed their historical average for income-to-price affordability percentage, and 39 counties representing a combined population of 3.6 million (1.4 percent of total population) will exceed their historical peaks for income-to-price affordability percentage.
Click here to enlarge tableIf interest rates rise three-quarters of a percentage point, 576 counties with a combined population of 101 million (39 percent of total population) will exceed their historical average for income-to-price affordability percentage, and 46 counties with a combined population of 4.2 million (1.6 percent of total population) will exceed their historical peaks for income-to-price affordability percentage.
If interest rates rise one full percentage point, 630 counties with a combined population of 120 million (46 percent of total population) will exceed their historical averages for income-to-price affordability percentages, and 59 counties with a combined population of 4.7 million (1.8 percent of total population) will exceed their historical peaks for income-to-price affordability percentage.
Real Estate Listings Showcase


This website uses cookies to improve user experience. By using our website you consent in accordance with our Cookie Policy. Read More