The WPJ
Residential Real Estate News


U.S. Home Prices Rise for Six Consecutive Months, Says Latest Case-Shiller Index
 According to the latest S&P/Case-Shiller Home Price Indices, U.S. home prices continued to rise in the third quarter of 2012. The national composite was up 3.6% in the third quarter of 2012 versus the third quarter of 2011, and was up 2.2% versus the second quarter of 2012.
In September 2012, the 10- and 20-City Composites showed annual returns of +2.1% and +3.0%. Average home prices in the 10- and 20-City Composites were each up by 0.3% in September versus August 2012. Seventeen of the 20 MSAs and both Composites posted better annual returns in September versus August 2012; Detroit and Washington D.C. recorded a slight deceleration in their annual rates, and New York saw no change.
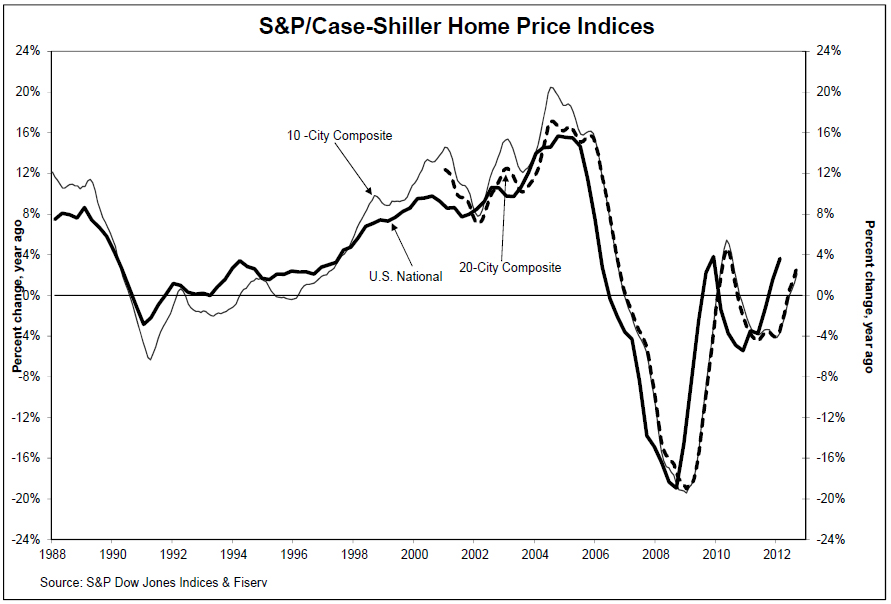
The chart above depicts the annual returns of the U.S. National, the 10-City Composite and the 20-City Composite Home Price Indices. The S&P/Case-Shiller U.S. National Home Price Index, which covers all nine U.S. census divisions, recorded a 3.6% gain in the third quarter of 2012 over the third quarter of 2011. In September 2012, the 10- and 20-City Composites posted annual increases of 2.1% and 3.0%, respectively.
"Home prices rose in the third quarter, marking the sixth consecutive month of increasing prices," says David M. Blitzer, Chairman of the Index Committee at S&P Dow Jones Indices. "In September's report all three headline composites and 17 of the 20 cities gained over their levels of a year ago. Month-over-month, 13 cities and both Composites posted positive monthly gains.
"The National Composite increased by 3.6% from the same quarter in 2011 and by 2.2% from the second quarter of 2012. The 10- and 20-City Composites have posted positive annual returns for four consecutive months with a +2.1% and +3.0% annual change in September, respectively. Month-over-month, both Composites have recorded increases for six consecutive months, with the most recent monthly gain being +0.3% for each Composite.
"We are entering the seasonally weak part of the year. The headline figures, which are not seasonally adjusted, showed five cities with lower prices in September versus only one in August; in the seasonally adjusted data the pattern was reversed: one city fell in September versus two in August. Despite the seasons, housing continues to improve.
"Phoenix continues to lead the recovery with a +20.4% annual growth rate. Atlanta has finally reversed 26 months of annual declines with a +0.1% annual rate as observed in September's housing data. At the other end of the spectrum, Chicago and New York were the only two cities to post annual declines of 1.5% and 2.3% respectively and were also down 0.6% and 0.1% month-over-month.
"Thirteen of the 20 cities recorded positive monthly returns; Boston, Charlotte, Chicago, Cleveland and New York saw modest drops in home prices in September as compared to August; Tampa and Washington D.C. were flat. With six months of consistently rising home prices, it is safe to say that we are now in the midst of a recovery in the housing market."
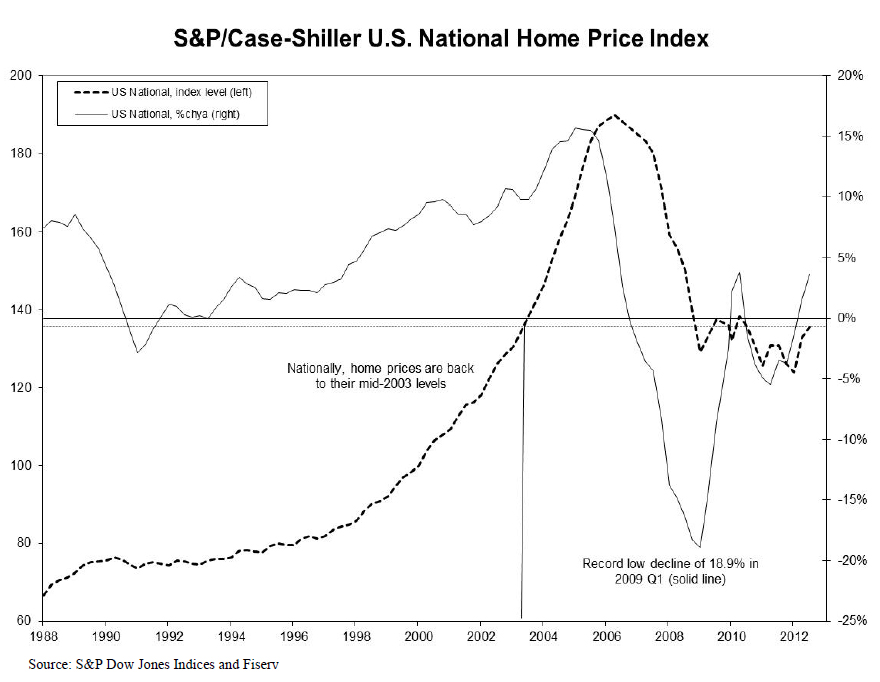
The chart on the previous page shows the index levels for the U.S. National Home Price Index, as well as its annual returns. As of the third quarter of 2012, average home prices across the United States are back at their mid-2003 levels. At the end of the third quarter of 2012, the National Index was up 2.2% over the second quarter of 2012 and 3.6% above the third quarter of 2011.
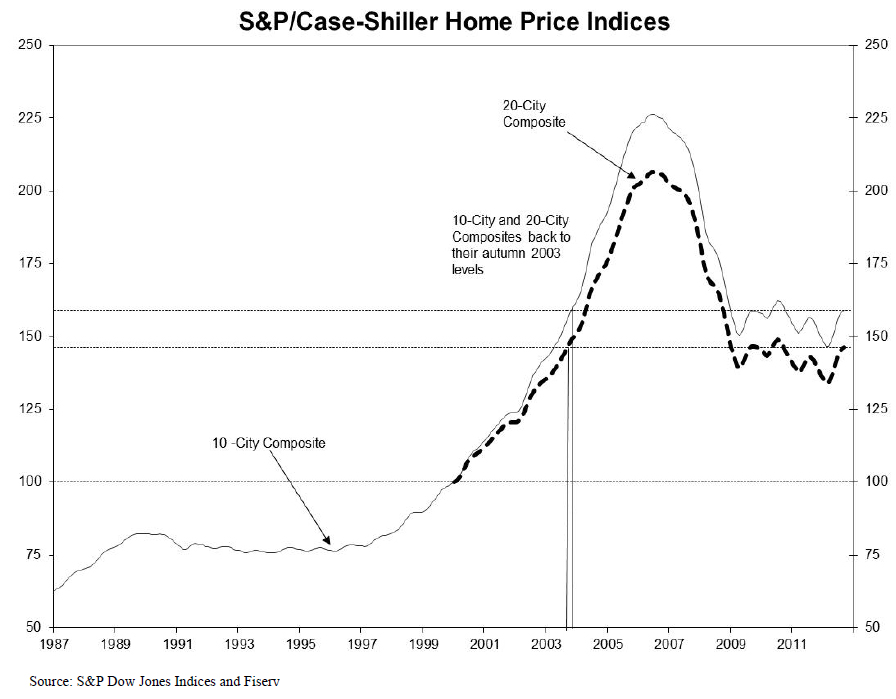
The chart above shows the index levels for the 10-City and 20-City Composite Indices. As of September 2012, average home prices across the United States for the 10-City and 20-City Composites are back to their autumn 2003 levels. Measured from their June/July 2006 peaks, the decline for both Composites is approximately 29% through September 2012. For both Composites, the September 2012 levels are approximately 9% above their recent lows seen in March 2012.
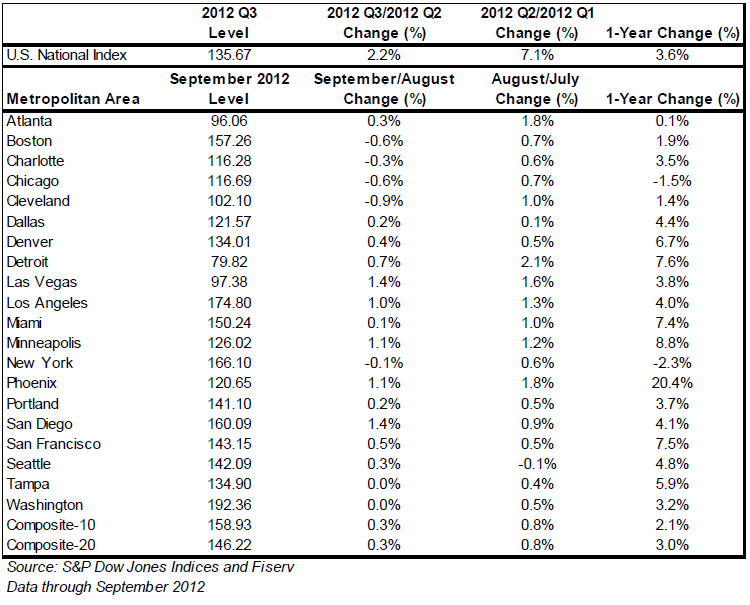
In September 2012, 13 MSAs and both Composites posted positive monthly gains. Home prices in Tampa and Washington DC saw no change from August to September. Boston, Charlotte, Chicago, Cleveland and New York saw a slight drop in prices in September. Phoenix recorded the highest increase in annual rate, up 20.4% from its September 2011 level. Chicago and New York were the only two cities that fared worse year-over-year with respective annual rates of -1.5% and -2.3%.
Atlanta, Detroit and Las Vegas remain the only three cities with average home prices below their January 2000 levels. Detroit with a 79.82 print, is nearly 20% below its January 2000 level.
The table below summarizes the results for September 2012. The S&P/Case-Shiller Home Price Indices are revised for the 24 prior months,
Real Estate Listings Showcase


This website uses cookies to improve user experience. By using our website you consent in accordance with our Cookie Policy. Read More