The WPJ
Residential Real Estate News


CoreLogic's November Home Price Index Shows Fourth Consecutive Monthly Decline
Based on CoreLogic 's November Home Price Index (HPI) report, home prices in the U.S. decreased 1.4 percent on a month-over-month basis, the fourth consecutive monthly decline.
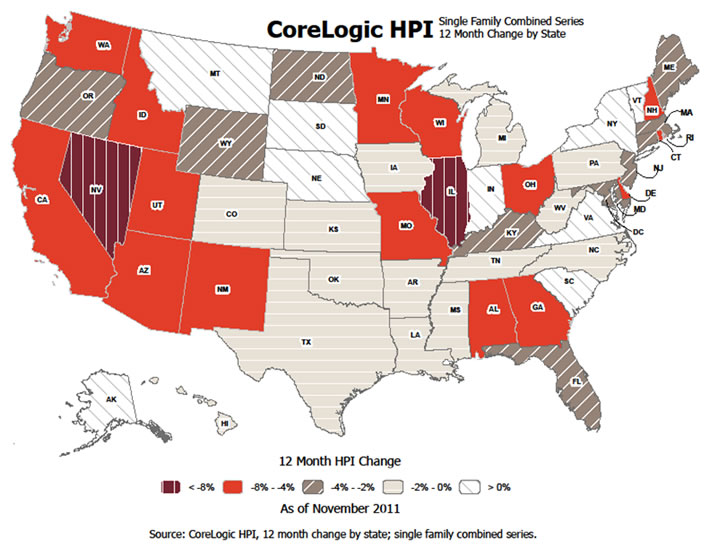
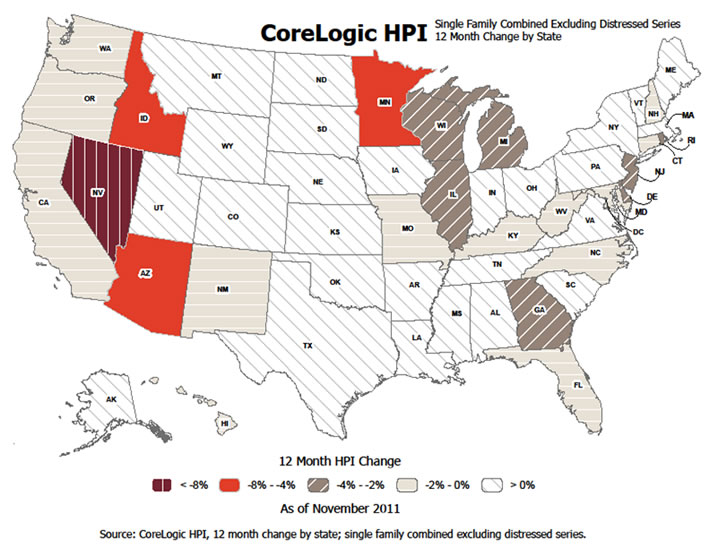
According to the CoreLogic HPI, national home prices, including distressed sales, also declined by 4.3 percent on a year-over-year basis in November 2011 compared to November 2010. This follows a decline of 3.7 percent in October 2011 compared to October 2010. Excluding distressed sales, year-over-year prices declined by 0.6 percent in November 2011 compared to November 2010 and by 1.6* percent in October 2011 compared to October 2010. Distressed sales include short sales and real estate owned (REO) transactions.
"With one month of data left to report, it appears that the healthy, non-distressed market will be very modestly down in 2011. Distressed sales continue to put downward pressure on prices and is a factor that must be addressed in 2012 for a housing recovery to become a reality," said Mark Fleming, chief economist for CoreLogic.
Report Highlights as of November 2011:
- Including distressed sales, the five states with the highest appreciation were: Vermont (+4.3 percent), South Carolina (+2.8 percent), District of Columbia (+2.1 percent), Nebraska (+1.9 percent) and New York (+1.7 percent).
- Including distressed sales, the five states with the greatest depreciation were: Nevada (-11.2 percent), Illinois (-9.7 percent), Minnesota (-7.8 percent), Georgia (-7.7 percent) and Ohio (-7.2 percent).
- Excluding distressed sales, the five states with the highest appreciation were: Maine (+4.9 percent), South Carolina (+4.9 percent), Montana (+3.8 percent), Indiana (+3.3 percent) and Louisiana (+2.4 percent).
- Excluding distressed sales, the five states with the greatest depreciation were: Nevada (-8.8 percent), Arizona (-4.9 percent), Minnesota (-4.7 percent), Idaho (-4.1 percent) and Georgia (-3.6 percent).
- Including distressed transactions, the peak-to-current change in the national HPI (from April 2006 to November 2011) was -32.8 percent. Excluding distressed transactions, the peak-to-current change in the HPI for the same period was -23.1 percent.
- Of the top 100 Core Based Statistical Areas (CBSAs) measured by population, 77 are showing year-over-year declines in November, three fewer than in October.
Real Estate Listings Showcase


This website uses cookies to improve user experience. By using our website you consent in accordance with our Cookie Policy. Read More