The WPJ
Residential Real Estate News


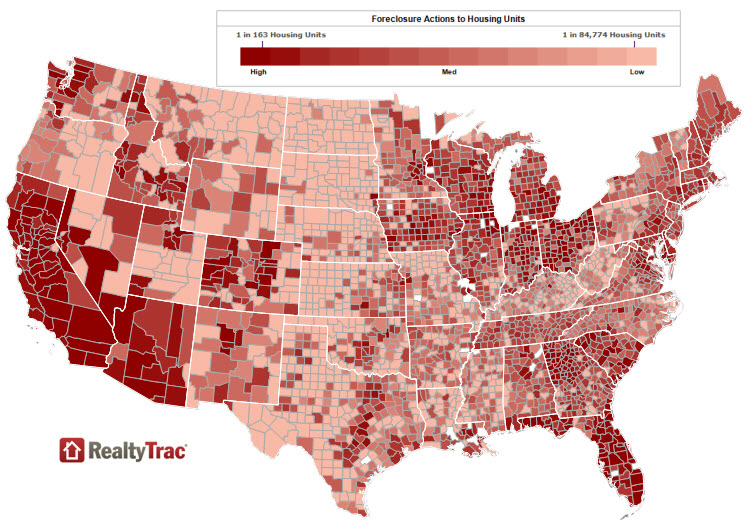
Total U.S. Foreclosures Top 1.8 Million in 2012, a 36% Decline From 2010 Peak
According to RealtyTrac's recently released Year-End 2012 U.S. Foreclosure Market Report, a total of 2,304,941 foreclosure filings -- default notices, scheduled auctions and bank repossessions -- were reported on 1,836,634 U.S. properties in 2012, down 3 percent from 2011 and down 36 percent from the peak of 2.9 million properties with foreclosure filings in 2010.
The report also shows that 1.39 percent of U.S. housing units (one in every 72) had at least one foreclosure filing during the year, down from 1.45 percent of housing units in 2011 and down from 2.23 percent of housing units in 2010.
"2012 was the year of the judicial foreclosure, with foreclosure activity increasing from 2011 in 20 of the 26 states that primarily use the judicial process, and a judicial state -- Florida -- posting the nation's highest state foreclosure rate for the first time since the housing crisis began," said Daren Blomquist, vice president at RealtyTrac. "Meanwhile foreclosure activity continued to decline in 19 of the 24 states that use the more streamlined non-judicial foreclosure process, but there could be a backlog of delayed foreclosures building up in some of those states as well as the result of recent state legislation and court rulings that raise the bar for lenders to foreclose."
Other high-level findings from the report:
- Foreclosure activity in 2012 increased from 2011 in 25 states -- 20 of which primarily use the longer judicial foreclosure process -- including New Jersey (55 percent increase), Florida (53 percent increase), Connecticut (48 percent increase), Indiana (46 percent increase), Illinois (33 percent increase) and New York (31 percent increase).
- Foreclosure activity in 2012 decreased from 2011 in 25 states -- 19 of which primarily use the more streamlined non-judicial foreclosure process -- including Nevada (57 percent decrease), Utah (40 percent decrease), Oregon (40 percent decrease), Arizona (33 percent decrease), California (25 percent decrease) and Michigan (23 percent decrease).
- Florida posted the nation's highest state foreclosure rate in 2012, with 3.11 percent of housing units (one in 32) receiving a foreclosure filing during the year. Other states with top 5 foreclosure rates were Nevada (2.70 percent), Arizona (2.69 percent), Georgia (2.58 percent), and Illinois (2.58 percent).
- December foreclosure activity dropped 10 percent from the previous month to the lowest level since April 2007, a 68-month low, and fourth quarter foreclosure activity was at the lowest quarterly level since the third quarter of 2007 despite a 9 percent quarterly increase in bank repossessions.
- The average time to complete a foreclosure nationwide in the fourth quarter increased 8 percent from the previous quarter to a record-high 414 days.
- Lower foreclosure inventory gave sellers the upper hand and helped median sales prices in the first 10 months of 2012 to increase from the same time period in 2011 in 25 states. Median sales prices nationwide during the first 10 months of 2012 on average were 99 percent of median list prices.
- In January 2013, 10.9 million homeowners nationwide -- representing 26 percent of all outstanding homes with a mortgage -- were seriously underwater, meaning they owed at least 25 percent more on their home than what it was worth. That was down from 12.5 million homeowners representing 28 percent of all homes with a mortgage a year earlier in January 2012.
"That could mean that although we are comfortably past the peak of the foreclosure problem nationally, 2013 is likely to be book-ended by two discrete jumps in foreclosure activity," Blomquist added. "We expect to see continued increases in judicial foreclosure states near the beginning of the year as lenders finish catching up with the backlogs in those states, and another set of increases in some non-judicial states near the end of the year as lenders adjust to the new laws and process some deferred foreclosures in those states."
December activity hits 68-month low, bank repossessions increase in fourth quarter
Foreclosure filings were reported on 162,511 U.S. properties in December, a 10 percent decrease from the previous month and down 21 percent from December 2011. December's total was the lowest monthly total since April 2007 -- a 68-month low. All three types of foreclosure filings -- default notices (NOD, LIS), scheduled foreclosure auctions (NTS, NFS), and bank repossessions (REO) decreased both on a monthly and annual basis in December.
Foreclosure filings were reported on 503,462 U.S. properties during the fourth quarter, a 5 percent decrease from the previous quarter -- despite a 9 percent quarter-over-quarter increase in bank repossessions -- and a 14 percent decrease from the fourth quarter of 2011. The fourth quarter total was the lowest quarterly total since the third quarter of 2007, when 448,145 U.S. properties received foreclosure filings.
Florida, Nevada, Arizona post top state foreclosure rates
More than 3 percent of Florida housing units (3.11 percent, or one in 32) had at least one foreclosure filing in 2012, giving it the nation's highest state foreclosure rate for the year. A total of 279,230 Florida properties had a foreclosure filing during the year, a 53 percent increase from 2011 but still 42 percent below the more than 485,000 Florida properties with foreclosure filings in 2010.
After five consecutive years with the highest state foreclosure rate, Nevada dropped to No. 2 on the list in 2012 thanks to a 57 percent drop in foreclosure activity from 2011. A total of 31,658 Nevada properties had a foreclosure filing during the year, 2.70 percent of all housing units in the state (one in every 37).
Arizona foreclosure activity in 2012 decreased 33 percent from 2011 and was down 51 percent from 2010, lowering the state's foreclosure rate to the third highest in the nation following three consecutive years with the second highest rate. A total of 76,487 Arizona properties had foreclosure filings during the year, 2.69 percent of all housing units in the state (one in 37).
Georgia posted the nation's fourth highest state foreclosure rate, with 2.58 percent of housing units (one in 39) receiving at least one foreclosure filing in 2012, and Illinois posted the nation's fifth highest state foreclosure rate, also with 2.58 percent of housing units (one in 39) receiving at least one foreclosure filing during the year.
Other states with foreclosure rates among the nation's 10 highest were California (2.33 percent), Ohio (1.75 percent), Michigan (1.69 percent), South Carolina (1.66 percent), and Colorado (1.64 percent).
Foreclosure inventory rises from low point in May, still 31 percent below peak
As of the end of the year, more than 1.5 million homes were in some stage of foreclosure or bank-owned, up 9 percent from the end of 2011, but still 31 percent below the peak of 2.2 million at the end of 2010. Foreclosure inventory had dropped to a 57-month low of 1.3 million in May 2012, but has since risen off that 57-month low.
Florida accounted for the biggest share of foreclosure inventory of any state with 305,766 properties in some stage of foreclosure or bank owned (20 percent of the national total), followed by California with 212,172 (14 percent), Illinois with 135,858 (9 percent), Ohio with 76,015 (5 percent), and New York with 69,044 (5 percent).
Lenders with the most inventory of bank-owned (REO) properties were the government-backed entities of Fannie Mae, Freddie Mac and the U.S. Department of Housing and Urban Development (HUD) with a combined 26 percent of all REO inventory, followed by Bank of America with 8 percent, Wells Fargo with 6 percent, US BankCorp with 4 percent and Chase with 4 percent.
Of the properties in some stage of foreclosure or bank owned at the end of 2012, an estimated 37 percent had a market value between $100,000 and $200,000, while an estimated 27 percent had a market value between $50,000 and $100,000, and an estimated 15 percent had a market value between $200,000 and $300,000.
Median home prices up in 25 states, 1.6 million fewer homeowners underwater
Lower foreclosure inventory during the year may have helped home prices to hit bottom and start rising in many markets during the year. Median home prices during the first 10 months of 2012 rose compared to the same time period in 2011 in 25 states and in 16 of the nation's 20 largest metro areas.
Nationwide the average monthly median home price during the first 10 months of 2012 was $164,712 -- nearly identical to the average monthly median home price of $164,960 during the same time period in 2011. The average monthly list price during the first 12 months of 2012 was $166,110, showing that sellers on average were getting 99 percent of their asking price during the year.
"The influx of foreclosure activity in 2012 in many local markets should translate into more foreclosure inventory available for sale in 2013 in those markets," Blomquist noted. "That is good news for buyers and investors, but could result in some short-term weakness in home prices as the often-discounted foreclosure sales weigh down overall home values."
Rising home prices helped boost home values in 2012, thereby lifting many homeowners across the country out of negative equity compared to a year ago. About 10.9 million homeowners nationwide -- representing 26 percent of all homeowners with a mortgage -- owed at least 25 percent more on their combined mortgages than what their homes were worth as of January 2013, down from 12.5 million seriously underwater homeowners representing 28 percent of all homeowners with a mortgage in January 2012.
Average days to foreclose nationwide jumps to 414
U.S. properties foreclosed in the fourth quarter took an average of 414 days to complete the foreclosure process, up from 382 days in the third quarter and up from 348 days in the fourth quarter of 2011. It was the longest time to complete the foreclosure process since RealtyTrac began tracking the metric in the first quarter of 2007.
New York had the longest average time to foreclose, at 1,089 -- up from 1,072 days in the third quarter and up from 1,019 days in the fourth quarter of 2011 -- followed by New Jersey at 987 days -- up from 931 days in the third quarter and up from 964 days in the fourth quarter of 2011.
The average time to foreclose in Florida decreased for the second straight quarter but was still the third highest in the country at 853 days, followed by Hawaii at 781 days and Illinois at 697 days.
The average time to foreclose in Texas increased 17 percent from the previous quarter and was up 26 percent from a year ago, but the state still documented the shortest average time to complete a foreclosure, at 113 days.
Other states with the shortest foreclosure timelines in the fourth quarter were Delaware (145 days), Virginia (146 days), Alabama (163 days), Maine (168 days) and Georgia (170 days).
Top metro foreclosure rates
Despite a 25 percent decrease in foreclosure activity from 2011, Stockton, Calif., posted the nation's highest foreclosure rate in 2012 among metropolitan statistical areas with a population of 200,000 or more: 3.98 percent of housing units (one in 25) with a foreclosure filing during the year.
Six other California cities ranked in the top 20 highest metro foreclosure rates for the year, including Riverside-San Bernardino-Ontario at No. 2 (3.86 percent of housing units with a foreclosure filing), Modesto at No. 3 (3.82 percent), and Vallejo-Fairfield at No. 4 (3.73 percent). All seven California metro areas in the top 20 posted decreasing foreclosure activity from 2011.
Florida cities accounted for eight of the top 20 highest metro foreclosure rates in 2012, led by Miami at No. 5 (3.71 percent of housing units with a foreclosure filing), Palm Bay-Melbourne-Titusville at No. 6 (3.60 percent), and Orlando at No. 8 (3.46 percent). Seven out of the eight Florida metro areas in the top 20 documented an increase in foreclosure activity for the year.
Other metro areas with foreclosure rates in the top 20 were Atlanta at No. 7 (3.51 percent of housing units with a foreclosure filing), Chicago at No. 9 (3.31 percent), Rockford, Ill., at No. 10 (3.28 percent), Las Vegas at No. 16 (3.10 percent), and Phoenix at No. 17 (3.09 percent).
Real Estate Listings Showcase


This website uses cookies to improve user experience. By using our website you consent in accordance with our Cookie Policy. Read More