Residential Real Estate News

Over 80 Percent of U.S. Metros Experienced Home Price Increases in Q3
According to the National Association of Realtors' latest quarterly report, more than 80% of metro markets (182 out of 221) posted home price gains in the third quarter of 2023 as the 30-year fixed mortgage rate ranged from 6.81% to 7.31%.
Eleven percent of the 221 tracked metro areas registered double-digit price increases over the same period, up from 5% in the second quarter.

"Homeowners have accumulated sizable wealth, with a typical homeowner gaining more than $100,000 in overall net worth since 2019 and before the height of the pandemic," said NAR Chief Economist Lawrence Yun. "However, the persistent lack of available homes on the market will make the dream of homeownership increasingly difficult for younger adults unless housing supply is significantly boosted."
Compared to a year ago, the national median single-family existing-home price climbed 2.2% to $406,900. In the previous quarter, the year-over-year national median price declined 2.4%.
Among the major U.S. regions, the South saw the largest share of single-family existing-home sales (46%) in the third quarter, with year-over-year price appreciation of 1.7%. Prices also grew 5.3% in the Northeast, 5.2% in the Midwest and 0.6% in the West.
Year-over-year prices in the third quarter retreated by 10.3% in Austin, 1.5% in Phoenix, 1.2% in Salt Lake City and 1.1% in both Dallas and Houston. However, prices rose by 9.6% in San Jose, 8.7% in both Anaheim and San Diego, 6.6% in Boston and 5.7% in Miami.
"Following the big price changes during the last several years, it's natural to witness momentary swings in prices," Yun said. "Some markets that experienced sizable home price gains since 2020 have turned lower, resulting in temporary relief for prospective home buyers. Also, a few markets in the West that experienced price declines in the prior quarter have seen prices rise again."
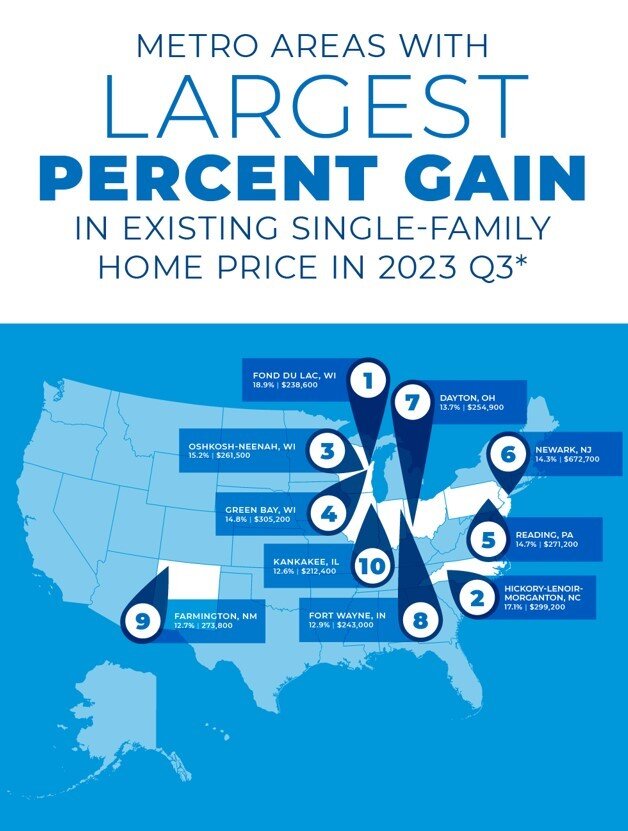
The top 10 metro areas with the largest year-over-year price increases all recorded gains of at least 12.6%, with six of those markets in the Midwest. Those include Fond du Lac, Wis. (18.9%); Hickory-Lenoir-Morganton, N.C. (17.1%); Oshkosh-Neenah, Wis. (15.2%); Green Bay, Wis. (14.8%); Reading, Pa. (14.7%); Newark, N.J.-Pa. (14.3%); Dayton, Ohio (13.7%); Fort Wayne, Ind. (12.9%); Farmington, N.M. (12.7%); and Kankakee, Ill. (12.6%).
Eight of the top 10 most expensive markets in the U.S. were in California. Overall, those markets are San Jose-Sunnyvale-Santa Clara, Calif. ($1,850,000; 9.6%); Anaheim-Santa Ana-Irvine, Calif. ($1,305,000; 8.7%); San Francisco-Oakland-Hayward, Calif. ($1,300,000; 1.6%); Urban Honolulu, Hawaii ($1,061,900; -5.8%); San Diego-Carlsbad, Calif. ($978,500; 8.7%); Salinas, Calif. ($945,300; 5.3%); Oxnard-Thousand Oaks-Ventura, Calif. ($921,500; 3.8%); Los Angeles-Long Beach-Glendale, Calif. ($897,600; 1.4%); San Luis Obispo-Paso Robles, Calif. ($889,900; 1.7%); and Boulder, Colo. ($857,800; 3.7%).
"With consumer inflation becoming more manageable, the Federal Reserve needs to consider cutting interest rates," Yun added. "In turn, Congress must consider incentives to boost housing supply and inventory so that more Americans can participate in wealth accumulation. The housing market shouldn't be accessible only to those who are paying in cash nor become a playground for the wealthy."
Less than one-fifth of markets (17%; 38 of 221) experienced home price declines in the third quarter, down from 41% in the second quarter.
Housing affordability worsened in the third quarter because of increasing home prices and mortgage rates. The monthly mortgage payment on a typical existing single-family home with a 20% down payment was $2,192, up 7% from the second quarter ($2,051) and 19.2% - or $354 - from one year ago. Families typically spent 26.8% of their income on mortgage payments, up from 25.3% in the prior quarter and 23.5% one year ago.
Lack of inventory and affordability continued to impact first-time buyers during the third quarter. For a typical starter home valued at $345,900 with a 10% down payment loan, the monthly mortgage payment rose to $2,149, up 6.9% from the previous quarter ($2,011). That was an increase of $343, or 19%, from one year ago ($1,806). First-time buyers typically spent 40.4% of their family income on mortgage payments, up from 38.2% in the prior quarter.
A family needed a qualifying income of at least $100,000 to afford a 10% down payment mortgage in 45.7% of markets, up from 40.3% in the prior quarter. Yet, a family needed a qualifying income of less than $50,000 to afford a home in 2.7% of markets, down from 6.3% in the previous quarter.