The WPJ
Residential Real Estate News


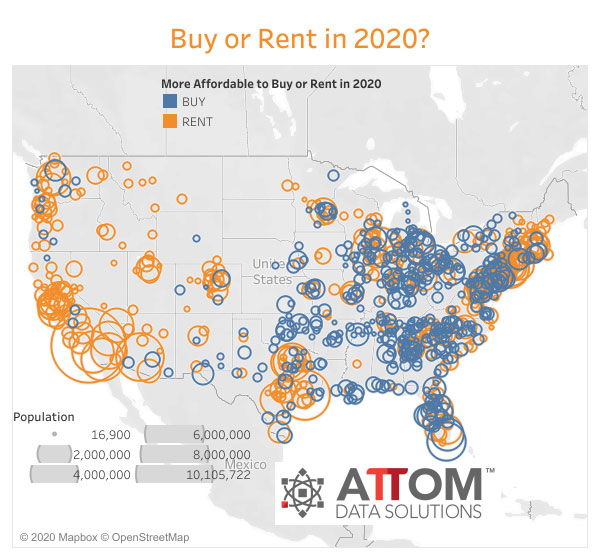
Buying More Affordable Than Renting a Home in Over 50 Percent of U.S. Markets
Based on ATTOM Data Solutions 2020 Rental Affordability Report, owning a median-priced, three-bedroom home in the U.S. is more affordable than renting a three-bedroom property in 455, or 53 percent, of the 855 U.S. counties analyzed for the report.
However, the analysis shows a split between different-sized markets, with ownership more affordable mainly in lightly populated counties and renting more affordable in more populous suburban or urban areas.
The analysis incorporated recently released fair market rent data for 2020 from the U.S. Department of Housing and Urban Development, wage data from the Bureau of Labor Statistics along with public record sales deed data from ATTOM Data Solutions in 855 U.S. counties with sufficient home sales data (see full methodology below).
"Home ownership is a better deal than renting for the average wage earner in a slim majority of U.S. housing markets. However, there are distinct differences between different places, depending on the size and location from core metro areas," said Todd Teta, chief product officer with ATTOM Data Solutions. "For sure, either buying or renting is a financial stretch or out of reach for individual wage earners throughout most of the country in the current climate. But with interest rates falling, owning a home can still be the more affordable option, even as prices keep rising."
Renting more affordable than buying in nation's most populated counties
Renting is more affordable than buying a home in 94, or 69 percent, of the 136 counties in the report that have a population of at least 500,000 or more.
Renting is the more affordable option in 36 of the 43 counties with a population of at least 1 million or more (84 percent) -- including Los Angeles County, CA; Cook County (Chicago), IL; Harris County (Houston), TX; Maricopa County (Phoenix), AZ and San Diego County, CA.
Other markets with a population of more than 1 million where it is more affordable to rent than buy include counties that surround or are inside of New York City; Dallas, TX; Seattle, WA; Las Vegas, NV; San Jose, CA; San Francisco, CA; San Antonio, TX and Boston, MA.
Counties with a population of at least 1 million, where buying a home is more affordable than renting, were Miami-Dade County, FL; Broward County, FL; Wayne County (Detroit), MI; Philadelphia County, PA; Hillsborough County (Tampa), FL; Cuyahoga County (Cleveland), OH and Allegheny County (Pittsburgh), PA.
Least affordable rental markets in California, Colorado, Hawaii
The report shows that renting a three-bedroom property requires an average of 37.6 percent of weekly wages across the 855 counties analyzed for the report.
The least affordable markets for renting are Santa Cruz County, CA (82.1 percent of average wages needed to rent); Marin County, CA (outside San Francisco) (75.3 percent); Park County, CO (southwest of Denver) (74.3 percent); Honolulu County, HI (74.2 percent) and Kauai County, HI (73.7 percent).
Counties with a population of at least 1 million, where rents consume the highest percentage of average wages, include Kings County (Brooklyn), NY (65.3 percent); Orange County, CA (outside Los Angeles) (64.7 percent); San Diego County, CA (59.6 percent); Contra Costa County, CA (outside San Francisco) (58.4 percent) and Queens County, NY (57.4 percent).
Most affordable rental markets in Tennessee, New York, Alabama, Ohio
The most affordable markets for renting are Roane County, TN (west of Knoxville) (20.1 percent of average wages needed to rent); Steuben County, NY (south of Rochester) (22.2 percent); Madison County (Huntsville), AL (22.4 percent); Greene County, OH (outside Dayton) (23.0 percent) and Sangamon County (Springfield), IL (23.2 percent).
Among counties with a population of 1 million or more, those most affordable for renting are Allegheny County (Pittsburgh), PA (24.3 percent); Cuyahoga County (Cleveland), OH (25.6 percent); Fulton County (Atlanta), GA (26.2 percent); Oakland County, MI (outside Detroit) (26.6 percent) and Wayne County (Detroit), MI (27.5 percent).
Home prices rising faster than rents in 67 percent of markets
Median home prices rose faster than average fair-market rents in 575 of the 855 counties analyzed in the report (67.3 percent), including Harris County (Houston), TX; San Bernardino County, CA (outside Los Angeles); Bexar County (San Antonio), TX; Wayne County (Detroit), MI and Philadelphia County, PA.
Average rents rose faster than median prices in 280 counties (32.7 percent), including Los Angeles County, CA; Cook County (Chicago), IL; Maricopa County (Phoenix), AZ; San Diego County, CA and Orange County, CA (outside Los Angeles).
Home prices rising faster than wages in 66 percent of markets
Median home prices rose faster than average weekly wages in 567 of the 855 counties analyzed in the report (66.3 percent), including Harris County (Houston), TX; Maricopa County (Phoenix), AZ; Miami-Dade County, FL; Riverside County, CA (outside Los Angeles) and Queens County, New York.
Average weekly wages rose faster than median home prices in 288 counties (33.7 percent), including Los Angeles County, CA; Cook County (Chicago), IL; San Diego County, CA; Orange County, CA (outside Los Angeles) and Kings County (Brooklyn), NY.
Wage growth outpacing rent growth in 57 percent of markets
Wages rose faster than average fair market rents in 484, or 56.6 percent, of the counties analyzed in the report including Harris County (Houston), TX; San Bernardino County, CA (outside Los Angeles); Bexar County (San Antonio), TX; Wayne County (Detroit), MI and Philadelphia County, PA.
Average rents rose faster than average wages in 371, or 43.4 percent, of counties in the report, including Los Angeles County, CA; Cook County (Chicago), IL; Maricopa County (Phoenix), AZ; San Diego County, CA and Orange County, CA (outside Los Angeles).
Real Estate Listings Showcase


This website uses cookies to improve user experience. By using our website you consent in accordance with our Cookie Policy. Read More