The WPJ
Residential Real Estate News


U.S. Foreclosure Activity Down 19 Percent Annually in Q3
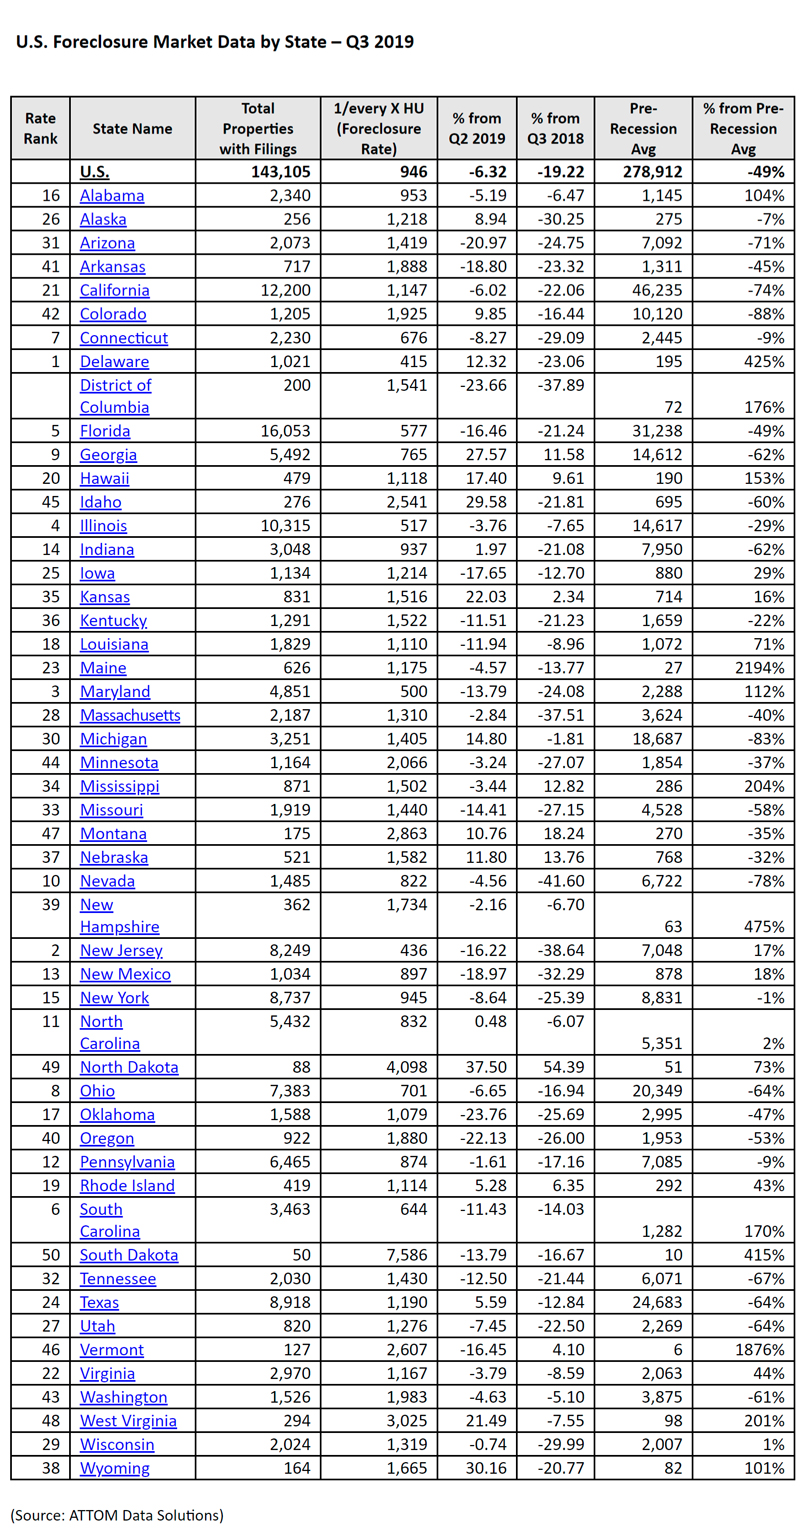
According to ATTOM Data Solutions Q3 2019 U.S. Foreclosure Market Report, there was a total of 143,105 U.S. properties with foreclosure filings -- default notices, scheduled auctions or bank repossessions -- in the third quarter, down 6 percent from the previous quarter and down 19 percent from a year ago to the lowest level since Q2 2005 -- a more than 13-year low.
U.S. foreclosure activity in Q3 2019 was 49 percent below the pre-recession average of 278,912 properties with foreclosure filings per quarter between Q1 2006 and Q3 2007 -- the 12th consecutive quarter where U.S. foreclosure activity has registered below the pre-recession average.
"Foreclosure activity continues to decline across the country, which is a good sign that the housing market and the broader economy remain strong - and that the lending excesses that helped bring down the economy during the Great Recession remain a memory," said Todd Teta, chief product officer at ATTOM Data Solutions. "This is not to say that everything in the latest foreclosure picture is rosy. Some states have seen their foreclosure rates increase this year, which could cause some concern. But overall, the foreclosure numbers reflect a market in which buyers can afford their homes and lenders remain careful in loaning to home buyers who have little chance of repaying."
Foreclosure starts down nationwide, up in 30 percent of local markets
Lenders started the foreclosure process on 78,394 U.S. properties in Q3 2019, down 8 percent from the previous quarter and down 15 percent from a year ago -- the 17th consecutive quarter with a year-over-year decrease in foreclosure starts.
Counter to the national trend, 14 states posted year-over-year increases in foreclosure starts in Q3 2019, including Montana (up 33 percent); Georgia (up 32 percent); Washington (up 16 percent); Louisiana (up 15 percent); and Michigan (up 12 percent).
Also counter to the national trend, 66 of 220 metropolitan statistical areas analyzed in the report (30 percent) posted a year-over-year increase in foreclosure starts in Q3 2019. Those markets with at least 1 million people that posted year-over-year increases included, Atlanta, Georgia (up 37 percent); Columbus, Ohio (up 27 percent); San Antonio, Texas (up 24 percent); Portland, Oregon (up 22 percent); and Tucson, Arizona (up 21 percent).
Highest foreclosure rates in Delaware, New Jersey, Maryland
Nationwide one in every 946 properties had a foreclosure filing in Q3 2019. States with the highest foreclosure rates in Q3 2019 were Delaware (one in every 415 housing units with a foreclosure filing); New Jersey (one in every 436); Maryland (one in every 500); Illinois (one in every 517); and Florida (one in every 577).
Among 220 metropolitan statistical areas analyzed in the report, those with the highest foreclosure rates in Q3 2019 were Atlantic City, New Jersey (one in every 269 housing units with a foreclosure filing); Trenton, New Jersey (one in every 312); Rockford, Illinois (one in every 366); Fayetteville, North Carolina (one in every 369); and Peoria, Illinois (one in every
Bank repossessions see slight uptick from previous quarter
Lenders repossessed 34,432 U.S. properties through foreclosure (REO) in Q3 2019, up 6 percent from the previous quarter but down 33 percent from a year ago.
Counter to the national trend, 16 states posted quarter-over-quarter decreases in REO activity in Q3 2019, including Maryland (down 37 percent); Tennessee (down 19 percent); Delaware (down 16 percent); New Jersey (down 13 percent); and Arizona (down 11 percent).
Average time to foreclose sees an uptick
Properties foreclosed in Q3 2019 had been in the foreclosure process an average of 841 days, up from 716 days in the previous quarter and up from 713 days in Q3 2018 to the highest level since Q4 2017.
States with the longest average foreclosure timelines for homes foreclosed in Q3 2018 were Indiana (1,633 days); Hawaii (1,626 days); Nevada (1,511 days); New Jersey (1,173 days); and Georgia (1,170 days).
States with the shortest average foreclosure timelines for homes foreclosed in Q3 2018 were Virginia (201 days); Montana (217 days); Mississippi (229 days); Alaska (258 days); and Oregon (283 days).
Real Estate Listings Showcase


This website uses cookies to improve user experience. By using our website you consent in accordance with our Cookie Policy. Read More