The WPJ
Residential Real Estate News


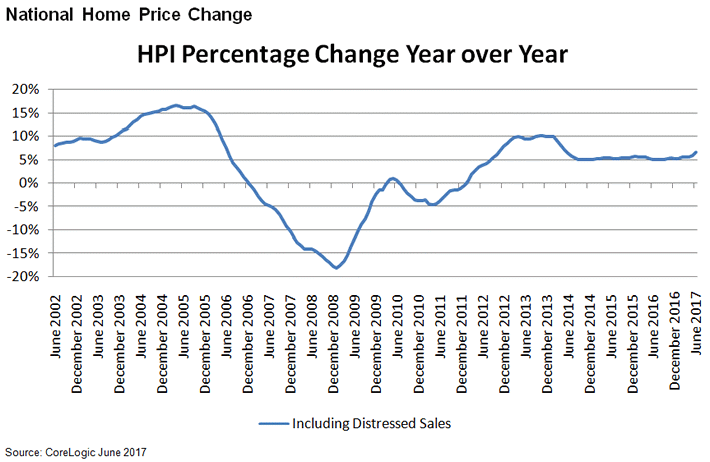
U.S. Home Prices Up 50 Percent Over 2011 Housing Bottom
Nationwide Home Prices Up 6.7 Percent Annually in June
According to CoreLogic's latest Home Price Index for June 2017, U.S. home prices are up strongly both year over year and month over month. Home prices nationally increased year over year by 6.7 percent from June 2016 to June 2017, and on a month-over-month basis, home prices increased by 1.1 percent in June 2017 compared with May 2017.
Quick U.S. Home Price FAQs:
Looking ahead, the CoreLogic HPI Forecast indicates that home prices will increase by 5.2 percent on a year-over-year basis from June 2017 to June 2018, and on a month-over-month basis home prices are expected to increase by 0.6 percent from June 2017 to July 2017. The CoreLogic HPI Forecast is a projection of home prices using the CoreLogic HPI and other economic variables. Values are derived from state-level forecasts by weighting indices according to the number of owner-occupied households for each state.- Four of the Top 10 Markets Considered Overvalued
- Unsold Housing Inventory is Lowest for Any Q2 in Over 30 Years
- Tight Inventory Driving Out Affordability
"The growth in sales is slowing down, and this is not due to lack of affordability, but rather a lack of inventory," said Dr. Frank Nothaft, chief economist for CoreLogic. "As of Q2 2017, the unsold inventory as a share of all households is 1.9 percent, which is the lowest Q2 reading in over 30 years."
Of the nation's 10 largest metropolitan areas measured by population, four were overvalued in June according to CoreLogic Market Conditions Indicators (MCI) data. These four metros include Denver-Aurora-Lakewood, CO, Houston-The Woodlands-Sugar Land, TX, Miami-Miami Beach-Kendall, FL and Washington-Arlington-Alexandria, DC-VA-MD-WV. By comparing home prices to their long-run, sustainable levels, which are supported by local market fundamentals such as disposable income, the MCI categorizes home prices in individual markets as undervalued, at value or overvalued. Because most homeowners use their income to pay for home mortgages, there is an established relationship between income levels and home prices. The MCI defines an overvalued market as one in which home prices are at least 10 percent higher than the long-term, sustainable level, while an undervalued market is one in which home prices are at least 10 percent below the sustainable level.
"Home prices are marching ever higher, up almost 50 percent since the trough in March 2011. With no end to the escalation in sight, affordability is rapidly deteriorating nationally and especially in some key markets such as Denver, Houston, Miami and Washington," said Frank Martell, president and CEO of CoreLogic. "While low mortgage rates are keeping the market affordable from a monthly payment perspective, affordability will likely become a much bigger challenge in the years ahead until the industry resolves the housing supply challenge."
Real Estate Listings Showcase


This website uses cookies to improve user experience. By using our website you consent in accordance with our Cookie Policy. Read More