The WPJ
Residential Real Estate News


Distressed Sales Account for 8 Percent of U.S. Homes Sold
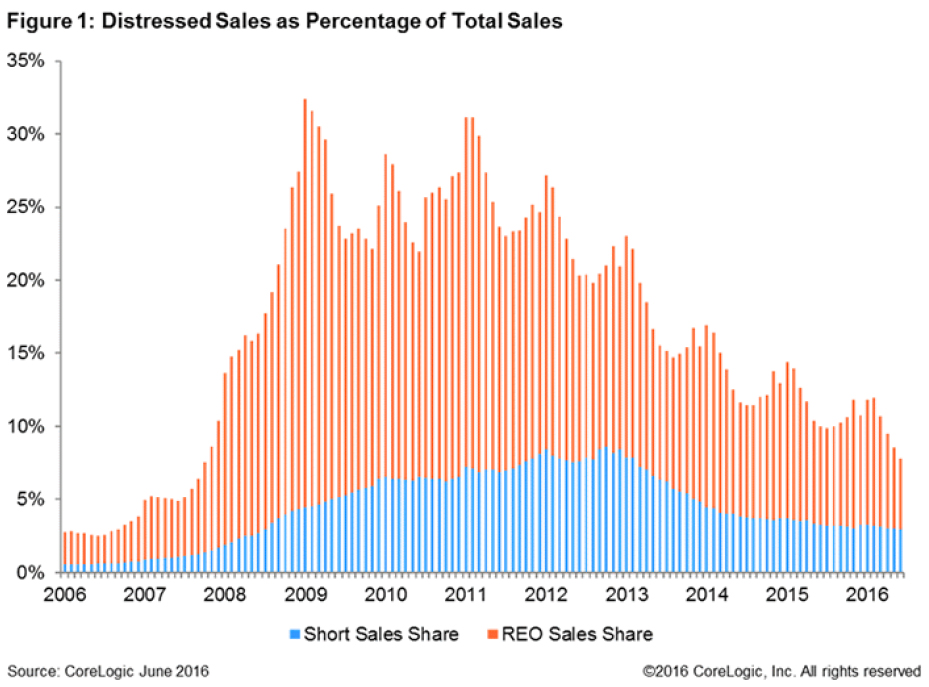
According to CoreLogic, distressed home sales in the U.S., which include REO and short sales, accounted for 7.8 percent of total home sales nationally in June 2016, down 2.2 percentage points from June 2015 and down 0.8 percentage points from May 2016.
Within the distressed category, REO sales accounted for 4.9 percent and short sales accounted for 2.9 percent of total home sales in June 2016. The REO sales share was 1.9 percentage points below the June 2015 share and is the lowest for any month since September 2007. At its peak in January 2009, distressed sales totaled 32.4 percent of all sales with REO sales representing 27.9 percent of that share.
Distress Sales Market Highlights Include:
- Of total sales in June 2016, distressed sales accounted for 7.8 percent and real estate-owned (REO) sales accounted for 4.9 percent
- The REO sales share was 23 percentage points below its peak of 27.9 percent in January 2009
- Distressed sales shares fell in most states, including the oil markets
Only eight states recorded increases in their distressed sales shares in June 2016 compared with a year earlier. Maryland had the largest share of distressed sales of any state at 19.4 percent in June 2016, followed by Connecticut (18.4 percent), Michigan (17.6 percent), Illinois (15.8 percent) and New Jersey (15.3 percent). North Dakota had the smallest distressed sales share at 2.5 percent. Oil states continued to see year-over-year declines in their distressed sales shares in June 2016. Texas saw a 1.2 percentage point decrease, Oklahoma saw a 0.5 percent decrease and North Dakota saw a 0.1 percentage point decrease. Florida had a 5.8 percentage point drop in its distressed sales share from a year earlier, the largest decline of any state. California had the largest improvement of any state from its peak distressed sales share, falling 60.6 percentage points from its January 2009 peak of 67.5 percent. While some states stand out as having high distressed sales shares, only North Dakota and the District of Columbia are close to their pre-crisis levels (each within one percentage point).
Of the 25 largest Core Based Statistical Areas (CBSAs) based on mortgage loan count, Baltimore-Columbia-Towson, Md. had the largest share of distressed sales at 19.1 percent, followed by Chicago-Naperville-Arlington Heights, Ill. (17.7 percent), Tampa-St. Petersburg-Clearwater, Fla. (16.6 percent), Orlando-Kissimmee-Sanford, Fla. (15.4 percent) and St Louis, Mo. (13.2 percent). Denver-Aurora-Lakewood, Colo. had the smallest distressed sales share at 2.4 percent among this same group of the country's largest CBSAs.
Two of the largest 25 CBSAs had year-over-year increases in their distressed sales share: Nassau County-Suffolk County, N.Y. was up by 1.3 percentage points and New York-Jersey City-White Plains, N.Y. was up by 0.1 percentage points. Orlando-Kissimmee-Sanford, Fla. had the largest year-over-year drop in its distressed sales share, declining by 8.6 percentage points from 24 percent in June 2015 to 15.4 percent in June 2016. Riverside-San Bernardino-Ontario, Calif. had the largest overall improvement in its distressed sales share from its peak value, dropping from 76.5 percent in February 2009 to 9.4 percent in June 2016.
Real Estate Listings Showcase


This website uses cookies to improve user experience. By using our website you consent in accordance with our Cookie Policy. Read More