The WPJ
Residential Real Estate News


U.S. Homeowner Equity Nationwide Increased $908 Billion in 2017
Homeowner Equity in U.S. Increased 12.2 Percent Year Over Year in 2017
According to CoreLogic's latest Home Equity Report for the fourth quarter of 2017, U.S. homeowners with mortgages (which account for roughly 63 percent of all properties) have seen their equity increase 12.2 percent year over year, representing a gain of $908.4 billion since the fourth quarter of 2016.
Quick FAQs on U.S. Homeowner Equity in Q4, 2017:
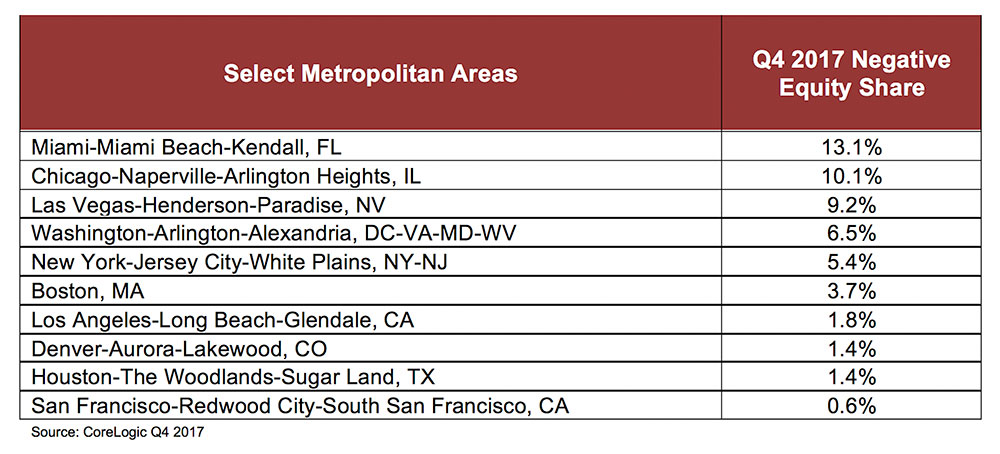
- Negative Equity Share Fell to 4.9 Percent in Q4 2017
- Quarter Over Quarter, 19,000 Residential Properties Regained Equity in Q4 2017
- About 2.5 Million Mortgaged Residential Properties Are Still in Negative Equity
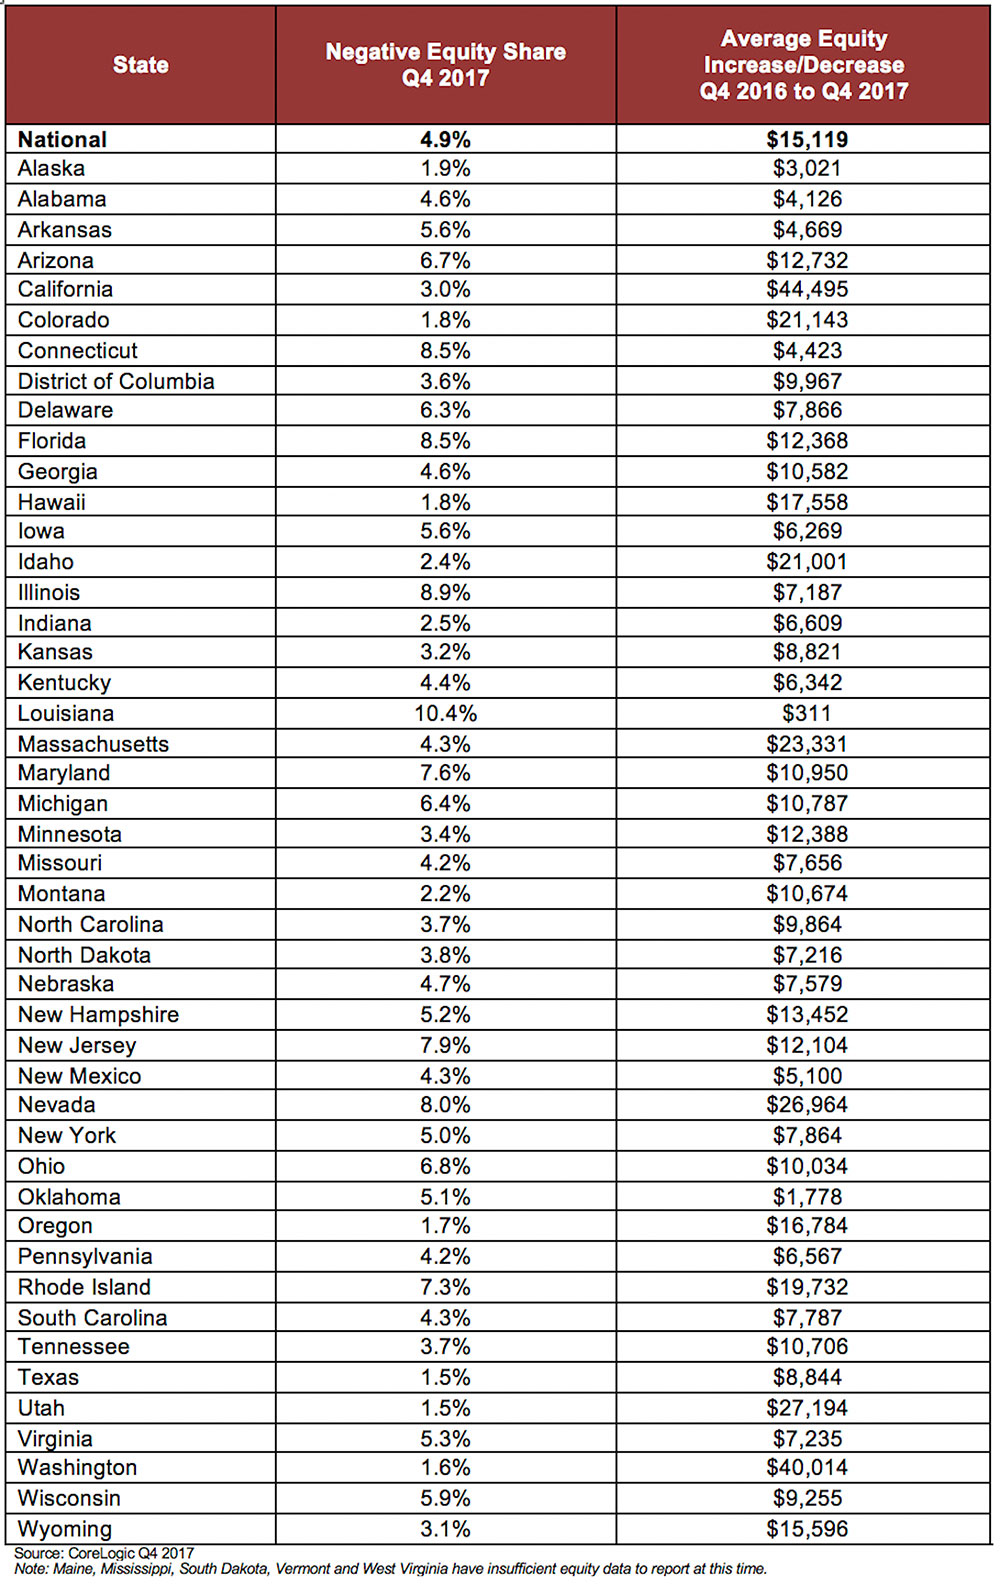
Additionally, homeowners gained more than $15,000 in home equity between the fourth quarter of 2016 and the fourth quarter of 2017. While home equity grew nationwide, western states experienced the largest increase. Washington homeowners gained an average of approximately $40,000 in home equity, and California homeowners gained an average of approximately $44,000 in home equity.
On a quarter-over-quarter basis, from the third quarter of 2017 to the fourth quarter of 2017, the total number of mortgaged homes in negative equity decreased 1 percent to 2.5 million homes, or 4.9 percent of all mortgaged properties (the third quarter of 2017 data was revised. Revisions with public records data are standard, and to ensure accuracy, CoreLogic incorporates the newly released public data to provide updated results.). Negative equity in the fourth quarter of 2017 decreased 21 percent year over year from 3.2 million homes - or 6.3 percent of all mortgaged properties - in the fourth quarter of 2016.
"Home-price growth has been the primary driver of home-equity wealth creation," said Dr. Frank Nothaft, chief economist for CoreLogic. "The CoreLogic Home Price Index grew 6.2 percent during 2017, the largest calendar-year increase since 2013. Likewise, the average growth in home equity was more than $15,000 during 2017, the most in four years. Because wealth gains spur additional consumer purchases, the rise in home-equity wealth during 2017 should add more than $50 billion to U.S. consumption spending over the next two to three years."
Negative equity, often referred to as being "underwater" or "upside down," applies to borrowers who owe more on their mortgages than their homes are worth. Negative equity can occur because of a decline in a home's value, an increase in mortgage debt or both. Negative equity peaked at 26 percent of mortgaged residential properties in the fourth quarter of 2009, based on the CoreLogic equity data analysis which began in the third quarter of 2009.
The national aggregate value of negative equity was approximately $283.1 billion at the end of the fourth quarter of 2017. This is up quarter over quarter by approximately $5.7 billion (or 2.1 percent), from $277.4 billion in the third quarter of 2017 and down year over year by approximately $3.2 billion (or 1.1 percent), from $286.3 billion in the fourth quarter of 2016.
"There are wide disparities in home-equity gains by geographic area, with higher-priced, capacity constrained markets along the East and West Coasts registering the largest increases," said Frank Martell, president and CEO of CoreLogic. "The average homeowner in California and Washington had a wealth gain of about $40,000, reflecting the high price of homes in California and the rapid appreciation in Washington. In contrast, the average owner in Louisiana had little change in their housing wealth during 2017, given much lower prices and modest price growth."
Real Estate Listings Showcase


This website uses cookies to improve user experience. By using our website you consent in accordance with our Cookie Policy. Read More