The WPJ
Residential Real Estate News


Over 1 Million U.S. Homeowners Regained Positive Equity in 2016
Over $783 Billion of Equity Gained by U.S. Home Borrowers in 2016
According to CoreLogic, U.S. homeowners with mortgages (roughly 63 percent of all U.S. homeowners) saw their equity increase by a total of $783 billion in 2016, an increase of 11.7 percent. Additionally, just over 1 million borrowers moved out of negative equity during 2016, increasing the percentage of homeowners with positive equity to 93.8 percent of all mortgaged properties, or approximately 48 million homes.
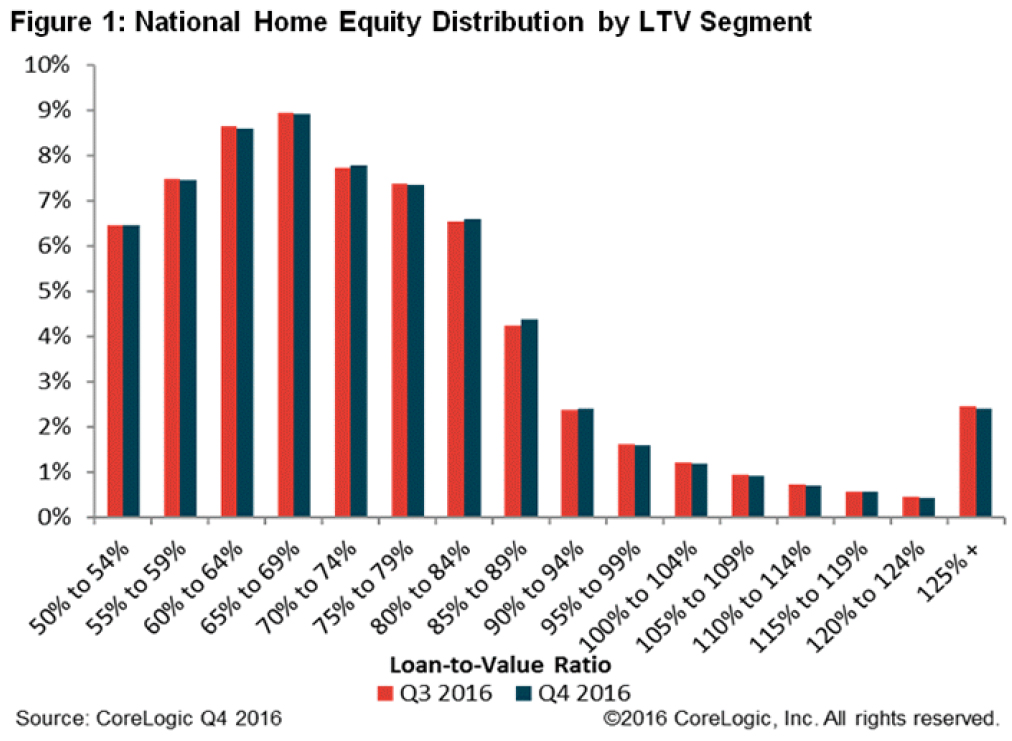
In Q4 2016, the total number of mortgaged residential properties with negative equity stood at 3.17 million, or 6.2 percent of all homes with a mortgage. This is a decrease of 2 percent quarter over quarter from 3.23 million homes, or 6.3 percent of all mortgaged properties, in Q3 2016 and a decrease of 25 percent year over year from 4.23 million homes, or 8.4 percent of all mortgaged properties, compared with Q4 2015.
Negative equity, often referred to as being "underwater" or "upside down," applies to borrowers who owe more on their mortgages than their homes are worth. Negative equity can occur because of a decline in home value, an increase in mortgage debt or both.
Negative equity peaked at 26 percent of mortgaged residential properties in Q4 2009 based on CoreLogic equity data analysis, which began in Q3 2009.
The national aggregate value of negative equity was approximately $283 billion at the end of Q4 2016, down quarter over quarter by approximately $700 million, or 0.3 percent, from $283.7 billion in Q3 2016; and down year over year by approximately $26 billion, or 8.4 percent, from $308.9 billion in Q4 2015.
"Average home equity rose by $13,700 for U.S. homeowners during 2016," said Dr. Frank Nothaft, chief economist for CoreLogic. "The equity build-up has been supported by home-price growth and paydown of principal. The CoreLogic Home Price Index for the U.S. rose 6.3 percent over the year ending December 2016. Further, about one-fourth of all outstanding mortgages have a term of 20 years or less, which amortize more quickly than 30-year loans and contribute to faster equity accumulation."
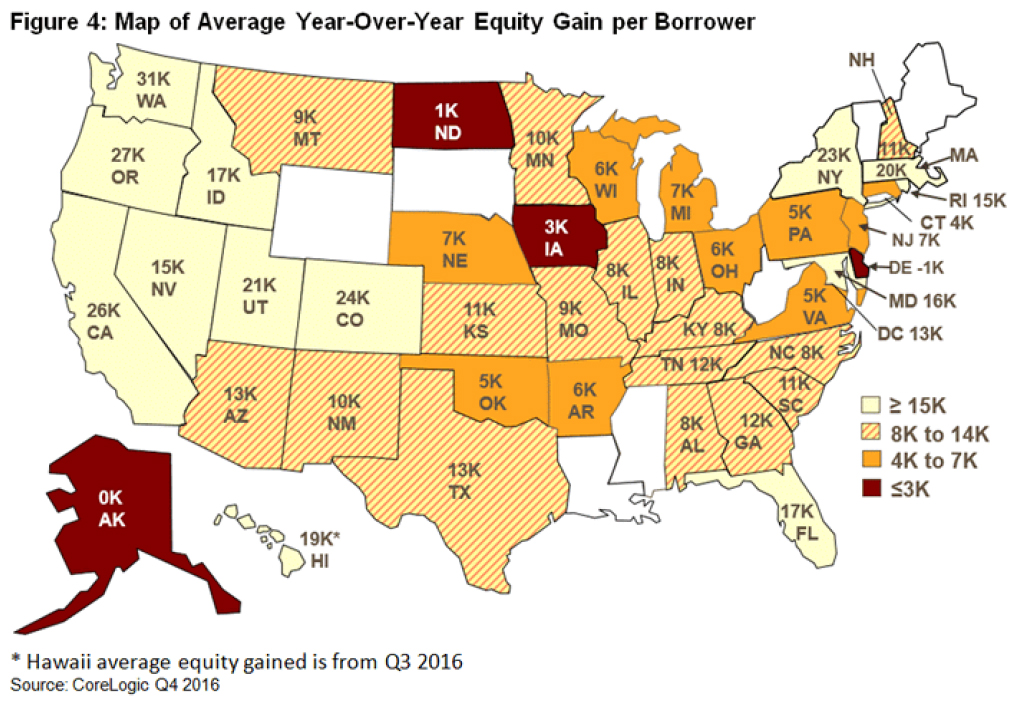
"Home equity gains were strongest in faster-appreciating and higher-priced home markets," said Frank Martell, president and CEO of CoreLogic. "The states with the largest home-price appreciation last year, according to the CoreLogic Home Price Index, were Washington and Oregon at 10.2 percent and 10.3 percent, respectively, with average homeowner equity gains of $31,000 and $27,000, respectively. This is double the pace for the U.S. as a whole. And while statewide home-price appreciation was slower in California at 5.8 percent, the high price of housing there led to California homeowners gaining an average of $26,000 in home equity wealth last year."
National Highlights as of Q4 2016:
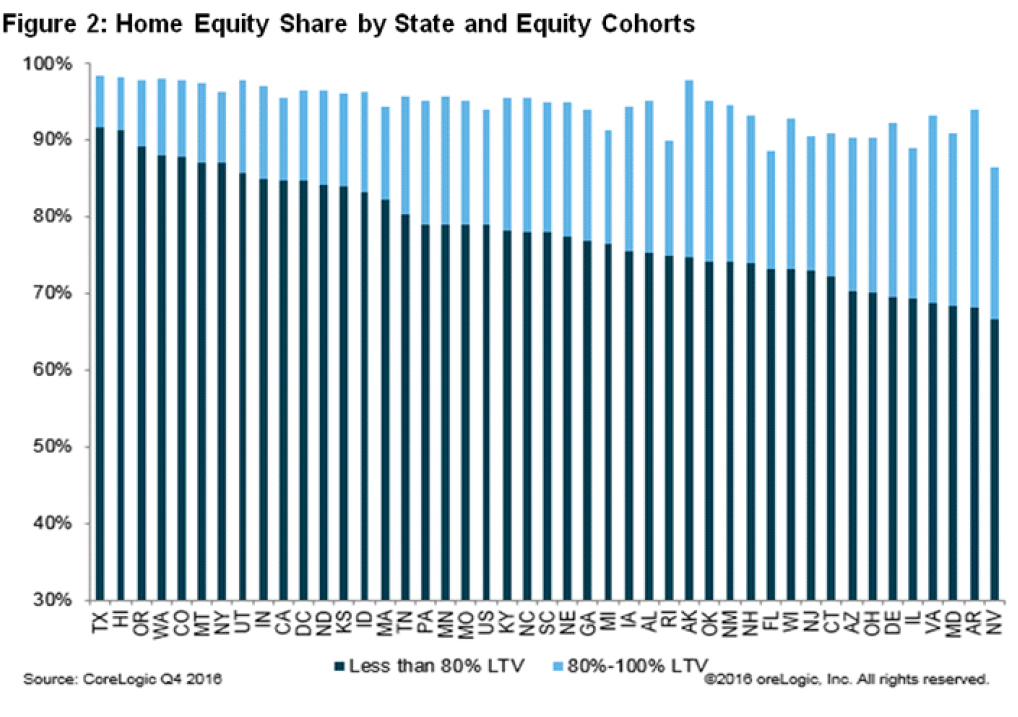
- Texas had the highest percentage of homes with positive equity at 98.4 percent, followed by Hawaii (98.1 percent), Alaska (97.9 percent), Colorado (97.9 percent), Oregon (97.9 percent), Utah (97.9 percent) and Washington (97.9 percent).
- On average, homeowner equity increased about $13,700 from Q4 2015 to Q4 2016 (for mortgaged properties). Washington had an average increase of $31,000, while Delaware experienced a small decline.
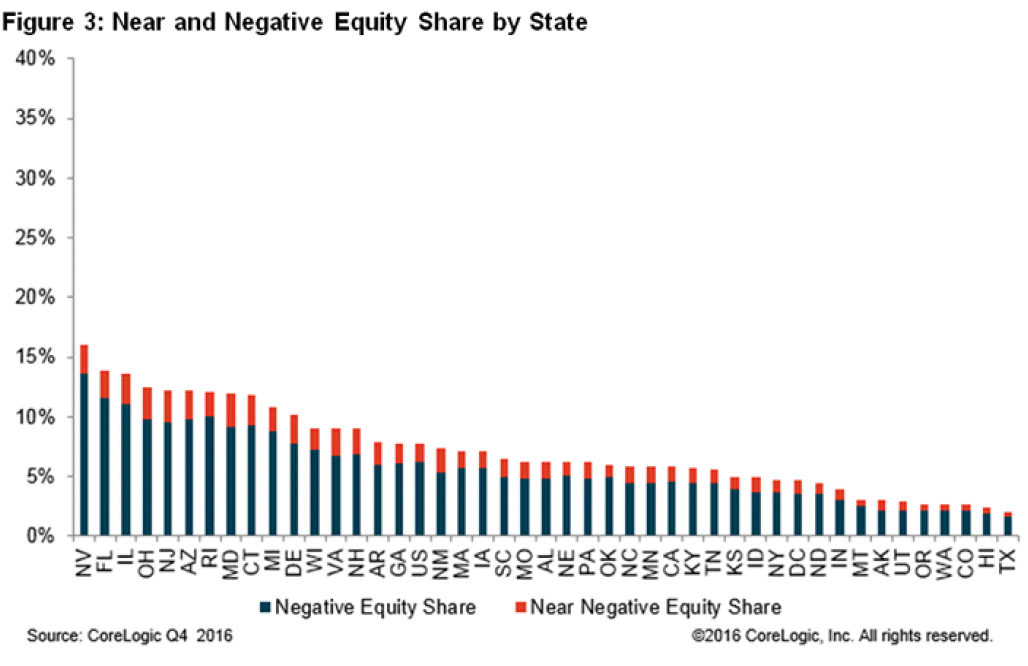
- Nevada had the highest percentage of homes with negative equity at 13.6 percent, followed by Florida (11.6 percent), Illinois (11.1 percent), Rhode Island (10 percent) and Arizona (9.8 percent). These top five states combined account for 29.7 percent of negative equity in the U.S., but only 16.3 percent of outstanding mortgages.
- Of the 10 largest metropolitan areas by population, San Francisco-Redwood City-South San Francisco, CA had the highest percentage of mortgaged properties in a positive equity position at 99.4 percent, followed by Houston-The Woodlands-Sugar Land, TX (98.5 percent), Denver-Aurora-Lakewood, CO (98.5 percent), Los Angeles-Long Beach-Glendale, CA (97 percent) and Boston, MA (95.3 percent).
- Of the same 10 largest metropolitan areas, Miami-Miami Beach-Kendall, FL had the highest percentage of mortgaged properties with negative equity at 16.1 percent, followed by Las Vegas-Henderson-Paradise, NV (15.5 percent), Chicago-Naperville-Arlington Heights, IL (12.6 percent), Washington-Arlington-Alexandria, DC-VA-MD-WV (8.4 percent) and New York-Jersey City-White Plains, NY-NJ (5.1 percent).
Real Estate Listings Showcase


This website uses cookies to improve user experience. By using our website you consent in accordance with our Cookie Policy. Read More