Residential Real Estate News


Home Flipping Profits in U.S Drop to 14 Year Low
Based on ATTOM's year-end 2022 U.S. Home Flipping Report, 407,417 single-family homes and condos in the United States were flipped in 2022. That was up 14 percent from 357,666 in 2021, and up 58 percent from 2020, to the highest point since at least 2005.
The report reveals that the number of homes flipped by investors last year represented 8.4 percent of all home sales, also the largest figure since at least 2005. The latest portion was up from 5.9 percent in 2021 and 5.8 percent in 2020.
But even as quick buy-renovate-and-resell turnarounds by investors shot up, gross profit margins on home flips in 2022 sank to their lowest level since 2008 following the second major drop in two years.
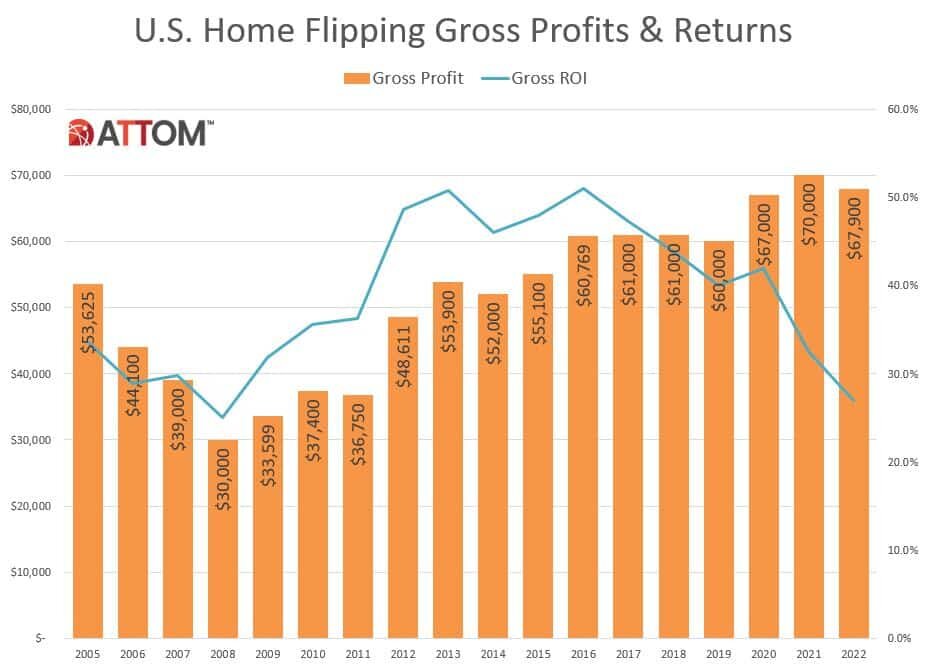
Homes flipped in 2022 typically generated a gross profit of $67,900 nationwide (the difference between the median sales price and the median amount originally paid by investors). That was down 3 percent from $70,000 in 2021 and translated into just a 26.9 percent return on investment compared to the original acquisition price. The latest nationwide ROI (before accounting for mortgage interest, property taxes, renovation expenses and other holding costs) was down from 32.6 percent in 2021 and from 41.9 percent in 2020.
Investors saw their profit margins drop for the fifth time in the past six years as the median value of the homes they flipped rose more slowly than the median price they paid to purchase properties - 12 percent versus 17 percent.
The decline in home-flipping profits in 2022 continued to cast a negative light on a niche of the U.S. housing market that is growing but also struggling to figure out how to profit from changing price trends.
The latest drop-off came during a year when the nation's decade-long home-price runup began to stall, leading to the weakest annual gains in three years and even a decline in the second half of 2022. That happened as rising home-mortgage rates, consumer price inflation and other forces cut into what home seekers could afford, reducing demand and cutting into prices investors were able to get on resale. But profits for home flippers had begun diminishing in 2017 even as the broader housing market was booming.
"Last Year, home flippers throughout the U.S. experienced another tough period as returns took yet another hit. For the second straight year, more investors were flipping but found no simple path to quick profits," said Rob Barber, chief executive officer at ATTOM. "Indeed, returns are now at the point where they could easily be wiped out by the carrying costs during the renovation and repair process, which usually accounts for 20 to 33 percent of the resale price. This year will reveal more about whether investors decide to find different ways to profit from home-flipping or take a step back and wait for conditions to get better."
Home flipping rates up in almost all housing markets, with biggest increases in South and West
Home flips as a portion of all home sales increased from 2021 to 2022 in 216 of the 218 metropolitan statistical areas analyzed in the report (99 percent). Among the 25 largest increases in annual flipping rates, 20 were in the South and West. They were led by Burlington, VT (rate up 283.7 percent); Prescott, AZ (up 183.1 percent); Bremerton, WA (up 182.7 percent); Jackson, MS (up 176 percent) and Honolulu, HI (up 172.6 percent). Metro areas qualified for the report if they had a population of at least 200,000 and at least 100 home flips in 2022.
Aside from Honolulu, the biggest increases in flipping rates in 2022 in metro areas with a population of 1 million or more were in Sacramento, CA (rate up 116.4 percent); Atlanta, GA (up 94.3 percent); Minneapolis, MN (up 72.8 percent) and Orlando, FL (up 72.2 percent).
The only metro areas where home flipping rates decreased from 2021 to 2022 were New Orleans, LA (rate down 8.2 percent) and Green Bay WI (down 2.9 percent).
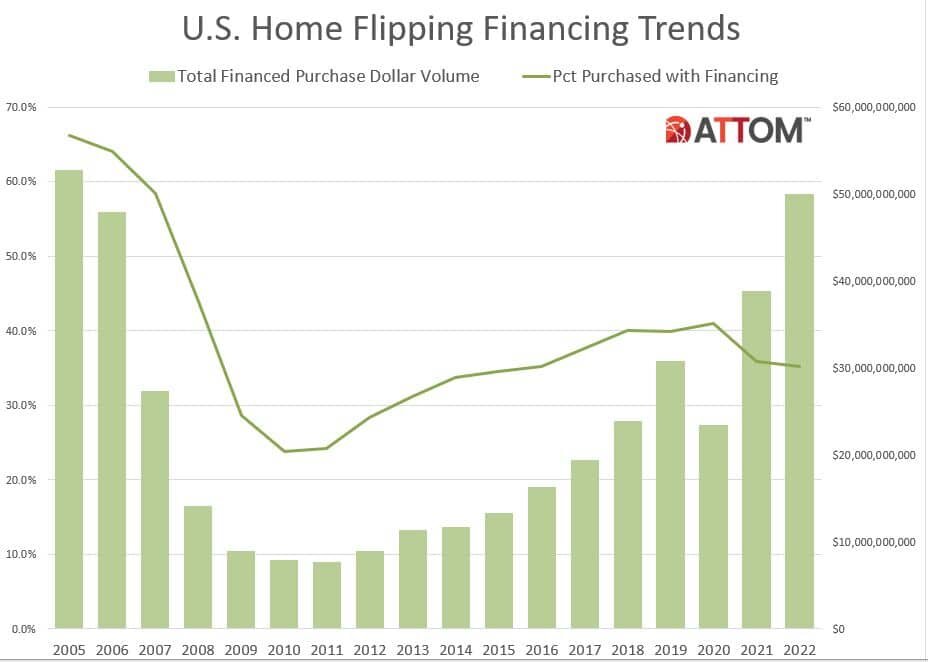
Home flips purchased with cash financing decrease again while all-cash transactions go up
Nationally, the percentage of flipped homes purchased with financing decreased in 2022 to 35.2 percent, down from 35.9 percent in 2021 and from 41 percent in 2020.
Meanwhile, 64.8 percent of homes flipped in 2022 were bought with all-cash, up from 64.1 percent in 2021 and from 59 percent two years earlier.
Among metropolitan areas with a population of 1 million or more and sufficient data to analyze, those with the highest percentage of flipped homes purchased by investors with financing in 2022, included Boston, MA (53.7 percent); San Diego, CA (51 percent); Seattle, WA (50.8 percent); Providence, RI (50.5 percent) and San Jose, CA (50.1 percent).
In that same group, the metro areas with the highest percentage of flips purchased with all cash included Detroit, MI (84.7 percent); Atlanta, GA (80.7 percent); Buffalo, NY (80.6 percent); Indianapolis, IN (77.4 percent) and Cleveland, OH (77.1 percent).
Typical gross profits on home flips decline in half the nation
Homes flipped in 2022 were sold for a median price nationwide of $320,000, generating a gross flipping profit of $67,900 above the median original purchase price paid by investors of $252,100. That national gross-profit figure was down from $70,000 in 2021 (the high point since at least 2005) but still up from $67,000 in 2020.
Among the 56 metro areas in the U.S. with a population of 1 million or more, those with the largest gross flipping profits in 2022 were San Jose, CA ($242,625); San Francisco, CA ($163,000); Washington, DC ($146,728); New York, NY (141,332) and Seattle, WA ($137,664).
The lowest gross flipping profits among metro areas with a population of at least 1 million in 2022 were in Kansas City, MO ($26,963); San Antonio, TX ($29,000); Houston, TX ($29,901); Indianapolis, IN ($34,532) and Dallas, TX ($36,970).
Home flipping returns drop in three-quarters of U.S., hitting lowest nationwide level in over 15 years
The gross profit margin on the typical home flip in the U.S. last year fell to 26.9 percent - the smallest investment return since at least 2005. The ROI on median-priced home flips nationwide has dropped 15 percentage points since 2020 and is off by 24 points since 2016.
Margins fell last year as the median nationwide resale price on flipped homes increased just 12.3 percent, from $285,000 in 2021 to $320,000 in 2022. That was less than the 17.3 percent increase in the price investors were paying when they bought homes (from $215,000 to $252,100).
The typical home-flipping investment return decreased from 2021 to 2022 in 168, or 77 percent, of the 218 metro areas analyzed.
Among metro areas with a population of 1 million or more, the biggest percentage-point decreases in profit margins during 2022 were in Rochester, NY (ROI down from 100.4 percent in 2021 to 55.6 percent in 2022); Oklahoma City, OK (down from 63.6 percent to 35.1 percent); Philadelphia, PA (down from 106.3 percent to 78 percent); Richmond, VA (down from 91.4 percent to 68.6 percent) and Washington, D.C. (down from 61 percent to 42.7 percent).
In that same group of markets with populations of at least 1 million, the largest increases in returns on investment on the typical home flips were in Cleveland, OH (ROI up from 26.8 percent in 2021 to 41.4 percent in 2022); New Orleans, LA (up from 54.1 percent to 64.6 percent); Cincinnati, OH (up from 38.4 percent to 47.4 percent); Honolulu, HI (up from 5.7 percent to 7.4 percent) and Orlando, FL (up from 17.6 percent to 18.7 percent).
Among metro areas with a population of at least 1 million, the biggest gross profit margins in 2022 were in Pittsburgh, PA (114.2 percent); Buffalo, NY (90.7 percent); Philadelphia, PA (78 percent); Baltimore, MD (72.9 percent) and Richmond, VA (68.6 percent). The smallest were in Honolulu, HI (7.4 percent); Austin, TX (8.2 percent); Sacramento, CA (9.4 percent); Phoenix, AZ (10.6 percent) and Houston, TX (11.3 percent).
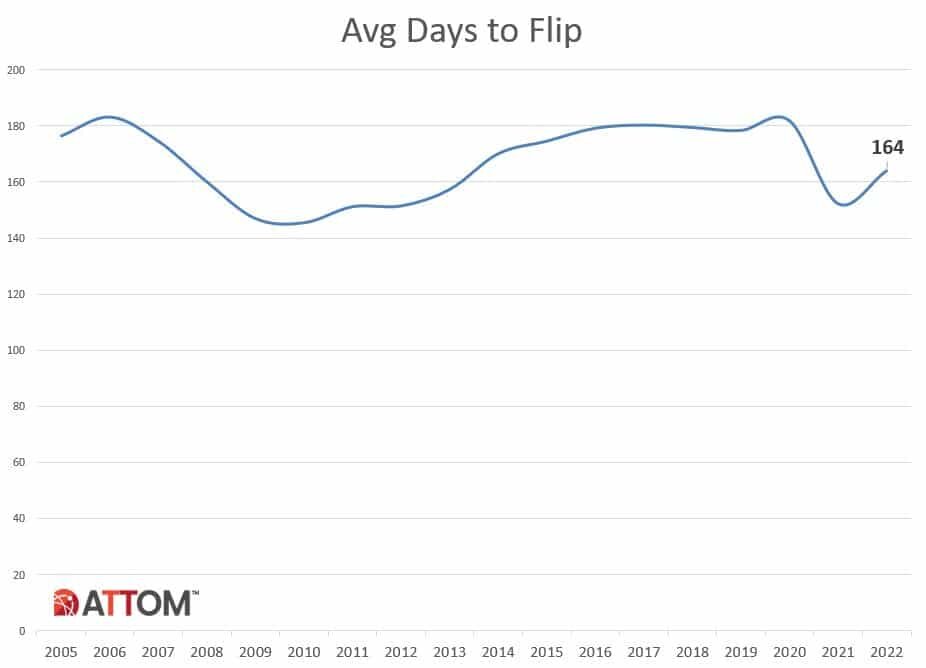
Average days to flip nationwide increases
Home flippers who sold homes in 2022 took an average of 164 days, or about 5 ½ months, to complete the flips. That was up from 152 days for homes flipped in 2021 but still down from 182 days in 2020.
Percent of flipped homes sold to FHA buyers ticks back up
Of the 407,417 U.S. homes flipped in 2022, just 8.4 percent were sold to buyers using a loan backed by the Federal Housing Administration (FHA). That was up slightly from 8 percent in 2021 but remained down 13.9 percent in 2020. It was less than one-third of the 27.4 percent sold to FHA buyers in 2010.
Among the 218 metro areas with a population of at least 200,000 and at least 100 home flips in 2022, those with the highest percentage of flipped homes sold in 2022 to FHA buyers -- typically first-time homebuyers -- were Merced, CA (25.6 percent); Visalia, CA (24.6 percent); Springfield, MA (22.2 percent); Laredo, TX (21.9 percent) and Modesto, CA (20.6 percent).
More than 200 counties had a home flipping rate of at least 10 percent in 2022
Among 955 counties with at least 50 home flips in 2022, there were 219 counties where flips accounted for at least 10 percent of all home sales last year. The top five were all in Georgia: Douglas County, GA (outside Atlanta) (19.5 percent); Lumpkin County, GA (north of Atlanta) (19.2 percent); Clayton County, GA (outside Atlanta) (18.6 percent); Paulding County, GA (outside Marietta) (18.5 percent) and Rockdale County, GA (outside Atlanta) (18 percent).
"While declining margin is certainly a cause for caution, it is important to remember that these numbers are somewhat backward looking in that they reflect dispositions of properties that were acquired in 2021 or early 2022 amidst the Covid-induced bidding wars in many locales", said Maksim Stavinsky, Co-Founder and President of Roc360. "On the other hand, it is encouraging that investors were able to clear in excess of four hundred thousand properties - the most ever - in an environment of rising interest rates, without a meaningful increase in project timelines." Roc360 last week announced the closing of its asset acquisition of Finance of America Commercial, a business purpose loan originator, so it is continuing to bet on growth in the space.
High-level takeaways from fourth-quarter 2022 data:
- The 80,335 home flips in the fourth quarter of 2022 represented a flipping rate of 8.4 percent.
- The share of homes flipped in the fourth quarter of 2022 that were purchased by investors with financing represented 33.5 percent of all homes flipped in the quarter, down from 36.3 percent in the previous quarter and from 34.3 percent in the fourth quarter of 2021. The share purchased with cash rose to 66.5 percent, up from 63.7 percent in the third quarter of 2022 and 65.7 percent in the fourth quarter of 2021.
- The gross-flipping profit on median-priced home flips in the fourth quarter of 2022 was $50,000, the smallest amount since the first quarter of 2013. The latest figure represented a typical 20 percent return on investment (percentage of original purchase price). That was down from 24.9 percent in the previous quarter and from 27.3 percent in the same period of 2021, to the lowest point since the first quarter of 2009.
- The quarterly decrease in the ROI was the eighth in the last nine quarters.
- Home flips completed in the fourth quarter of 2022 took an average of 165 days, up from 153 days in the fourth quarter of 2021.