The WPJ
Residential Real Estate News


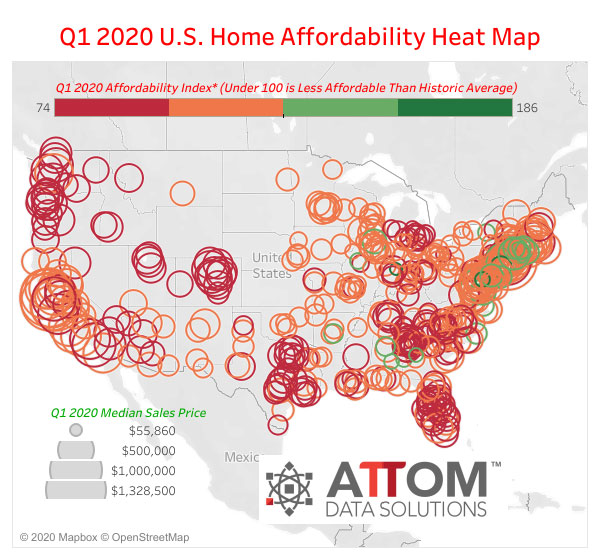
Home Affordability Improves in U.S. Prior to Coronavirus Outbreak
ATTOM Data Solutions newly released first-quarter 2020 U.S. Home Affordability Report is showing this week that the median U.S. home price in the first quarter of 2020 was unaffordable for average wage earners in 319 of 483, or 66 percent of the U.S. counties analyzed in the report. But that figure is down from 70.4 percent in the fourth quarter of 2019 and 69.8 percent from the first quarter of 2019.
The report also shows that owning a median-priced home in the first quarter of 2020 in the United States - costing $252,500 - consumes 31.1 percent of the national average wage. That percentage is down from 31.4 percent in the fourth quarter of 2019 and 31.6 percent in the first quarter of 2019, to the lowest percentage since the fourth quarter of 2017, when the average workers were spending 30.8 percent of wages to own a home.
"Home affordability has inched ahead this year across the United States as buying a house or a condo gets closer and closer to the level where the average wage earner can swing the deal within standard lending guidelines. While the national median price still remains a bit out of reach for the average wage earner, the affordability gap has narrowed to the smallest point in more than two years," said Todd Teta, chief product officer with ATTOM Data Solutions. "It seems bizarre that median home prices have risen 8 percent over the past 12 years while average wages grew by less than half that amount. But falling interest rates continue making up the difference, dropping monthly home ownership payments in a majority of the country."
"All that may change in a huge way over the next few months as the impact of the coronavirus hits the housing market. We are entering a period of great uncertainty," he added. "But in the initial months of the year, the picture has appeared to continue to brighten for home seekers."
The most populous counties where a median-priced home in the first quarter of 2020 was not affordable for average wage earners include Los Angeles County, CA; Maricopa County (Phoenix), AZ; San Diego County, CA; Orange County, CA (in the Los Angeles, CA metropolitan statistical area) and Miami-Dade County, FL. The report analyzed 483 counties with a population of at least 100,000 and at least 100 homes sales in the first quarter of 2020.
The 164 counties (34 percent) where a median-priced home in the first quarter of 2020 is affordable for average wage earners include Cook County (Chicago) IL; Harris County (Houston), TX; Dallas County, TX; Wayne County (Detroit), MI and Philadelphia County, PA.
Home price appreciation outpacing wage growth in 64 percent of markets
Annual home price appreciation is outpacing average weekly wage growth in the first quarter of 2020 in 309 of the 483 counties analyzed in the report (64 percent), with the largest counties including Los Angeles County, CA; Maricopa County (Phoenix), AZ; San Diego County, CA; Orange County, CA (in the Los Angeles, CA metropolitan statistical area) and Miami-Dade County, FL.
Average annualized wage growth is outpacing home price appreciation in 174 of the 483 counties (36 percent), including Cook County (Chicago), IL; Harris County (Houston), TX; Queens County, NY; King County (Seattle), WA and Tarrant County (Fort Worth), TX.
At least 30 percent of wages needed to buy a home in more than half of markets
Among the 483 counties analyzed in the report, 288 (59.6 percent) currently require at least 30 percent of their annualized weekly wages to buy a home. Those counties that require the greatest percent of wages include Kings County (Brooklyn), NY (108.1 percent of annualized weekly wages needed to buy a home); Santa Cruz County, CA (in the San Jose metro area) (92.8 percent); Marin County, CA (in the San Francisco metro area) (91.5 percent); Maui County, HI (88.5 percent) and Monterey County, CA (in the San Francisco metro area) (86.8 percent).
A total of 195 counties in the report (40.4 percent) require less than 30 percent of their annualized weekly wages to buy a home. Those counties that require the smallest percent include Baltimore City/County, MD (9.5 percent of annualized weekly wages needed to buy a home); Madison County, IN (in the Indianapolis metro area) (10.8 percent); Bibb County, GA (in the Macon metro area) (11.4 percent); Calhoun County, MI (in the Battle Creek metro area) (11.7 percent) and Rock Island County, IL (in the Davenport metro area) (12.4 percent).
Two-thirds of markets more affordable than historic averages
Among the 483 counties in the report, 323 (66.9 percent) are more affordable than their historic affordability averages in the first quarter of 2020, up from 55.1 percent in the fourth quarter of 2019 and 49.7 percent from the first quarter of 2019.
Counties with the highest affordability indexes are Madison County, IN (in the Indianapolis metro area) (index of 186); Baltimore City/County, MD (159); Mercer County, NJ (in the Trenton metro area) (159); Peoria County, IL (149) and Onslow County, NC (in the Jacksonville metro area) (145).
Counties with at least 1 million people that are more affordable than their historic averages (indexes of at least 100 are considered more affordable compared to their historic averages) include Cook County (Chicago), IL (index of 128); Montgomery County, MD (in the Washington, DC, metro area) (122); New York County (Manhattan), NY (118); Fairfax County, VA (in the Washington, DC, metro area) (117) and Cuyahoga County (Cleveland), OH (116).
The biggest annual gains among other counties include Johnson County, IN (in the Indianapolis metro area) (index up 41 percent); Butte County, CA (in the Chico metro area) (up 36 percent); Niagara County, NY (in the Buffalo metro area) (up 35 percent); Onondaga County, NY (in the Syracuse metro area) (up 27 percent) and Saint Clair County, IL (in the St. Louis, MO, metro area) (up 26 percent).
Counties with at least 1 million people that saw the biggest annual improvement in their affordability indexes include New York County (Manhattan), NY (index up 23 percent); Bronx County, NY (up 19 percent); King County (Seattle), WA (up 14 percent); Alameda County (Oakland), CA (up 13 percent) and Contra Costa County, CA (in the San Francisco metro area) (up 12 percent).
One-third of markets less affordable than historic averages
Among the 483 counties analyzed in the report with a population of at least 100,000 and at least 100 home sales in the first quarter of 2020, 160 (33.1 percent) are less affordable than their historic affordability averages in the first quarter of 2020, down from 44.9 percent of counties in the previous quarter and 50.3 percent of counties in the first quarter of 2019.
Counties with the lowest affordability indexes include Canyon County, ID (in the Boise metro area) (index of 74); Orleans Parish (New Orleans), LA (80); Ada County, ID (in the Boise metro area) (80); Benton County, WA (east of Portland, OR) (81) and Genesee County, MI (in the Flint metro area) (82).
Counties with a population greater than 1 million that are less affordable than their historic averages (indexes of less than 100 are considered less affordable compared to their historic averages) include Wayne County (Detroit), MI (index of 86); Tarrant County (Fort Worth), TX (88); Dallas County, TX (90); Salt Lake County (Salt Lake City), UT (92) and Maricopa County (Phoenix), AZ (93).
Counties with the biggest year-over-year decreases in their affordability indexes are Madison County, IN (in the Indianapolis metro area) (down 54 percent); Bibb County, GA (in the Macon metro area) (down 17 percent); Warren County, NJ (in the Allentown, PA, metro area) (down 16 percent); Saint Louis City/County, MO (down 15 percent) and Erie County, PA (down 14 percent).
Among the counties with at least 1 million people, the only ones with a decline in their annual affordability indexes in the first quarter of 2020 are Philadelphia County, PA (index down 3 percent); Wayne County (Detroit), MI (down 1 percent); Suffolk County, NY (in the New York City metro area) (down 1 percent) and Mecklenburg County, NC (in the Charlotte metro area) (down 0.4 percent).
Real Estate Listings Showcase


This website uses cookies to improve user experience. By using our website you consent in accordance with our Cookie Policy. Read More