Residential Real Estate News


Profit Margins on U.S. Home Sales Spike to Decade High in Q3
Median Home Prices Reach New Record High in North America
According to ATTOM Data's newest quarterly U.S. Home Sales Report, profit margins on median-priced single-family home and condo sales across the United States jumped to 47.6 percent - the highest level since the end of the Great Recession a decade ago.
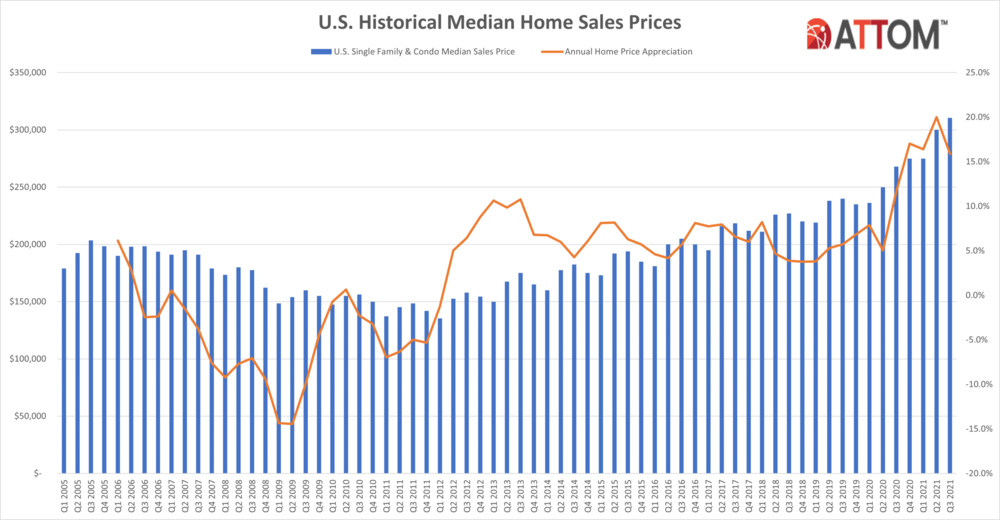
In yet another sign of how strong the U.S. housing market remains, the report reveals that the typical home sale across the country during the third quarter of 2021 generated a profit of $100,178 as the national median home price hit a record of $310,500. The latest profit level - also a new high - was up from $88,800 in the second quarter of 2021 and from $69,000 in the third quarter of 2020.
Those gains raised the typical return on investment that sellers made on their original purchase price nationwide from 42 percent in the second quarter of this year and 34.5 percent a year earlier. The investment-return increases marked the biggest quarterly jump since 2014 and the biggest annual surge since at least 2008.
Soaring profits in the third quarter came as the national median home price increased 3.5 percent from the second quarter of 2021 and 15.9 percent from the third quarter of 2020. The annual price surge marked the fifth straight quarter with year-over-year increases of at least 10 percent.
So hot was the national market in the third quarter that median home prices rose annually in 93 percent of U.S. metropolitan areas with enough data to analyze, while profit margins increased in 86 percent.
The latest price and profit improvements reflect a housing market that kept speeding ahead even as the U.S. economy only gradually recovered from widespread damage caused by the Coronavirus pandemic that hit early last year and continues to pose a threat. Amid rock-bottom interest rates and worries about living in congested virus-prone parts of the country, a glut of buyers has been chasing a tight supply of homes for sale over the past year and a half, raising demand and spiking prices.
"The third quarter of this year marked another period in a banner year for a housing market boom that's steaming ahead through its 10th year. Prices and seller profits again hit new highs since the market started coming back from the Great Recession in 2012," said Todd Teta, chief product officer at ATTOM. "There have been a couple of small hints of a possible slowdown in recent months, as we head into the normally quiet Fall and Winter seasons. The pandemic also remains a constant presence that could tamp things down. But, for now, the market engine seems to have nothing but high-octane gas in the tank."
Profit margins rise annually in nearly 90 percent of metro areas around the U.S.
Typical profit margins - the percent change between median purchase and resale prices - rose from the third quarter of 2020 to the third quarter of 2021 in 175 (86 percent) of 204 metro areas around the United States with sufficient data to analyze. Margins also increased from the second to the third quarter of this year in 168 of the 204 metros (82 percent). Metro areas were included if they had at least 1,000 single-family home and condo sales in the third quarter of 2021 and a population of at least 200,000.
The biggest annual increases in profit margins came in the metro areas of Boise City, ID (margin up from 61.4 percent in the third quarter of 2020 to 130.3 percent in the third quarter of 2021); Claremont-Lebanon, NH (up from 41.1 percent to 93.8 percent); Augusta, GA (up from 19.6 percent to 56.6 percent); Raleigh, NC (up from 30.4 percent to 67 percent) and Bellingham, WA (up from 69.5 percent to 105.6 percent).
Aside from Raleigh, the biggest annual profit-margin increases in metro areas with a population of at least 1 million in the third quarter of 2021 were in Detroit, MI (margin up from 43 percent to 68 percent); Rochester, NY (up from 39.4 percent to 63.8 percent); Austin, TX (up from 47.6 percent to 70.9 percent) and Pittsburgh, PA (up from 40.1 percent to 61.9 percent).
Profit margins stayed the same or dropped, year over year, in just 29 of the 204 metro areas analyzed (14 percent) while they declined quarterly in 36 (18 percent). The biggest annual decreases were in Salem, OR (margin down from 75.6 percent in the third quarter of 2020 to 48.3 percent in the third quarter of 2021); Brownsville, TX (down from 37.1 percent to 13 percent); Kansas City, MO (down from 43.6 percent to 25.1 percent); San Jose, CA (down from 86.2 percent to 71 percent) and McAllen, TX (down from 33.4 percent to 19.9 percent).
Aside from Kansas City and San Jose, the largest annual drops in profit margins among metro areas with a population of at least 1 million came in Los Angeles, CA (down from 54.3 percent to 44.5 percent); Cleveland, OH (down from 32.8 percent to 25.7 percent) and Las Vegas, NV (down from 43.8 percent to 37.2 percent).
Largest profit margins again in West; smallest in South
The West continued to have the largest profit margins on typical home sales around the country, with eight of the top 10 returns on investment in the third quarter of 2021 from among the 204 metropolitan areas with enough data to analyze. They were led by Boise City, ID (130.3 percent return); Bellingham, WA (105.6 percent); Claremont-Lebanon, NH (93.8 percent); Spokane, WA (87.7 percent) and Prescott, AZ (84.7 percent).
Eleven of the 15 smallest margins were in the South region of the country. The lowest were in Shreveport, LA (2 percent); Gulfport, MS (7.4 percent); Columbus, GA (9.9 percent); Atlantic City, NJ (12.4 percent) and Brownsville, TX (13 percent).
Prices up at least 10 percent in two-thirds of nation
Median home prices in the third quarter of 2021 exceeded values from a year earlier by at least 10 percent in 136 (67 percent) of the 204 metropolitan statistical areas with enough data to analyze. Nationally, the median price of $310,500 in the third quarter was up from $300,000 in the second quarter of 2021 and $268,000 in the third quarter of last year.
The biggest year-over-year increases in median home prices during the third quarter of 2021 came in Worcester, MA (up 42.9 percent); Barnstable, MA (up 32.5 percent); Boston, MA (up 28.4 percent); Boise, ID (up 28.3 percent) and Lakeland, FL (up 27.8 percent).
Aside from Boston, the largest annual increases in metro areas with a population of at least 1 million in the third quarter of 2021 were in Austin, TX (up 26 percent); Phoenix, AZ (up 25.5 percent); Las Vegas, NV (up 22.8 percent) and Tucson, AZ (up 22.4 percent).
Home prices in the third quarter of 2021 hit or tied all-time highs in 84 percent of the metro areas in the report, including New York, NY; Los Angeles, CA; Chicago, IL; Dallas, TX, and Houston, TX.
The largest year-over-year decreases in median prices during the third quarter of 2021 were in Brownsville, TX (down 11.9 percent); Pittsburgh, PA (down 10.1 percent); Gulfport, MS (down 8.8 percent); Santa Maria, CA (down 7 percent) and Charleston, SC (down 4.9 percent).
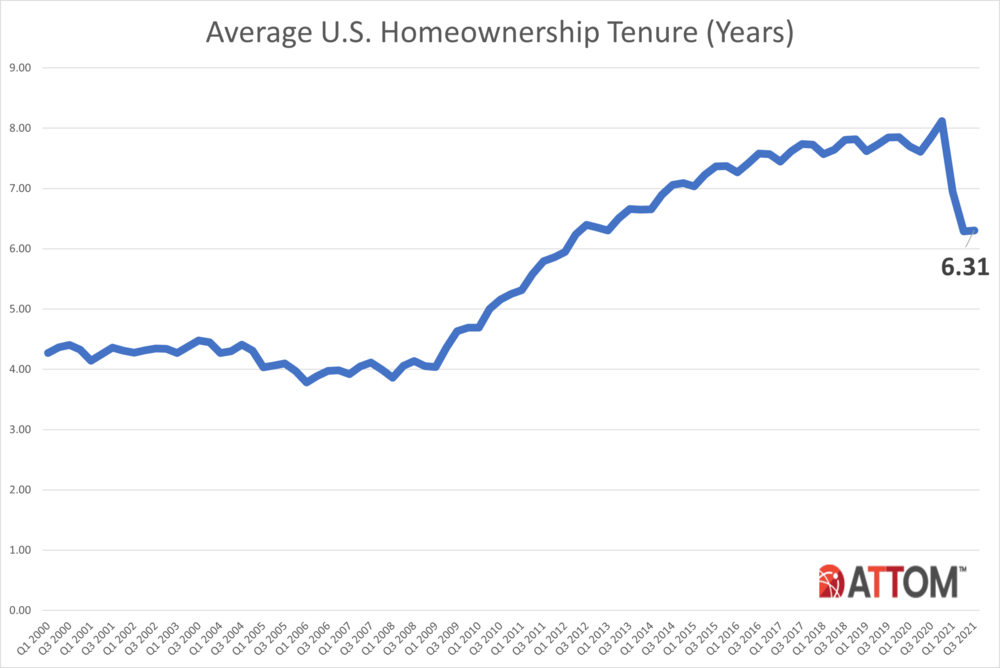
Homeownership tenure remains at eight-year low
Homeowners who sold in the third quarter of 2021 had owned their homes an average of 6.31 years, virtually unchanged from 6.29 years in the second quarter of 2021 and down by more than a year from 7.85 years in the third quarter of 2020. The last two quarters marked the shortest times between purchase and resale since the first quarter of 2013.
Among 109 metro areas with sufficient data to analyze, tenure decreased from the third quarter 2020 to the same period this year in 101 (93 percent). They were led by Lakeland, FL (tenure down 74 percent); Tucson, AZ (down 53 percent); Madera, CA (down 44 percent); Springfield, MA (down 43 percent) and Memphis, TN (down 43 percent).
Fifteen of the 20 longest average tenures among sellers in the third quarter of 2021 were in the Northeast or West regions. They were led by Manchester, NH (10.09 years); Bellingham, WA (9.91 years); Lake Havasu City, AZ (9.69 years); Kahului-Wailuku-Lahaina, HI (9.21) and Rockford, IL (8.81 years).
The smallest average tenures among third-quarter sellers were in Lakeland, FL (1.97 years); Bremerton, WA (2.79 years); Portland, ME (3.39 years); Gulfport, MS (4.05 years) and Tucson, AZ (4.06 years).
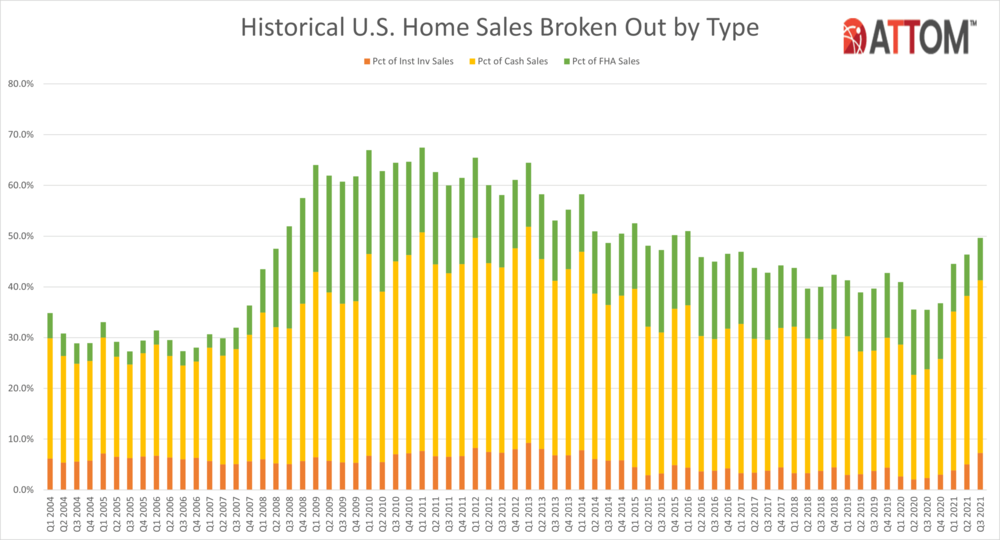
Cash sales at six-year high
Nationwide, all-cash purchases accounted for 34 percent of all single-family house and condo sales in the third quarter of 2021, the highest level since the first quarter of 2015. The third-quarter 2021 number was up from 33.2 percent in the second quarter of 2021 and from 21.4 percent in the third quarter of last year.
Among metropolitan statistical areas with a population of at least 200,000 and sufficient cash-sales data, those where cash sales represented the largest share all transactions in the third quarter of 2021 were Columbus, GA (74.6 percent of all sales); Atlanta, GA (69 percent); Macon, GA (59.3 percent); Youngstown, OH (56.6 percent) and Detroit, MI (56.2 percent).
Those where cash sales represented the smallest share of all transactions in the third quarter of 2021 included Lincoln, NE (15.7 percent); Greeley, CO (17 percent); Salem, OR (17.1 percent) and Washington, DC (17.2 percent) and Worcester, MA (18.7 percent).
Institutional investment up to seven-year high
Institutional investors nationwide accounted for 7.3 percent of all single-family house and condo purchases in the third quarter of 2021, the highest level since the first quarter of 2014. The latest figure was up from 5 percent in the second quarter of 2021 and was up three-fold from 2.4 percent in the third quarter of last year.
Among states with enough data to analyze, those with the largest percentages of sales to institutional investors in the third quarter of 2021 were Arizona (17.4 percent of all sales), Georgia (13.9 percent), Mississippi (12.8 percent), Nevada (12.7 percent) and North Carolina (11.3 percent).
States with the smallest levels of sales to institutional investors in the third quarter of 2021 were Hawaii (1.7 percent of all sales), Maine (1.8 percent), Vermont (2.2 percent), New Hampshire (2.5 percent) and Rhode Island (2.5 percent).
FHA-financed purchases remain at nearly 14-year low
Nationwide, buyers using Federal Housing Administration (FHA) loans accounted for only 8.3 percent of all single-family home and condo purchases in the third quarter of 2021, the second-lowest level since the fourth quarter of 2007. The latest figure was up slightly from 8.1 percent in the previous quarter but down from 11.8 percent a year earlier.
Among metropolitan statistical areas with a population of at least 200,000 and sufficient FHA-buyer data, those with the highest levels of FHA buyers in the third quarter of 2021 were Lakeland, FL (21 percent of all sales); Mobile, AL (18.3 percent); Visalia, CA (17.7 percent); Bakersfield, CA (17.3 percent) and Yuma, AZ (16.9 percent).
Lender-owned foreclosures represent just 1 percent of all sales
Home sales following foreclosures by banks and other lenders represented just 1.1 percent of all sales in the third quarter of 2021. That was down from 1.3 percent in the second quarter of 2021 and from 2.9 percent in the third quarter of last year.
Metro areas where so-called REO sales represented the largest portions of all sales in the third quarter of 2021 with a population of 200K or more and with sufficient data to analyze were Macon, GA (4.6 percent of all sales); Lansing, MI (3.1 percent); St. Louis, MO (2.4 percent); South Bend, IN (2.3 percent) and Baltimore, MD (2.3 percent).