The WPJ
Residential Real Estate News


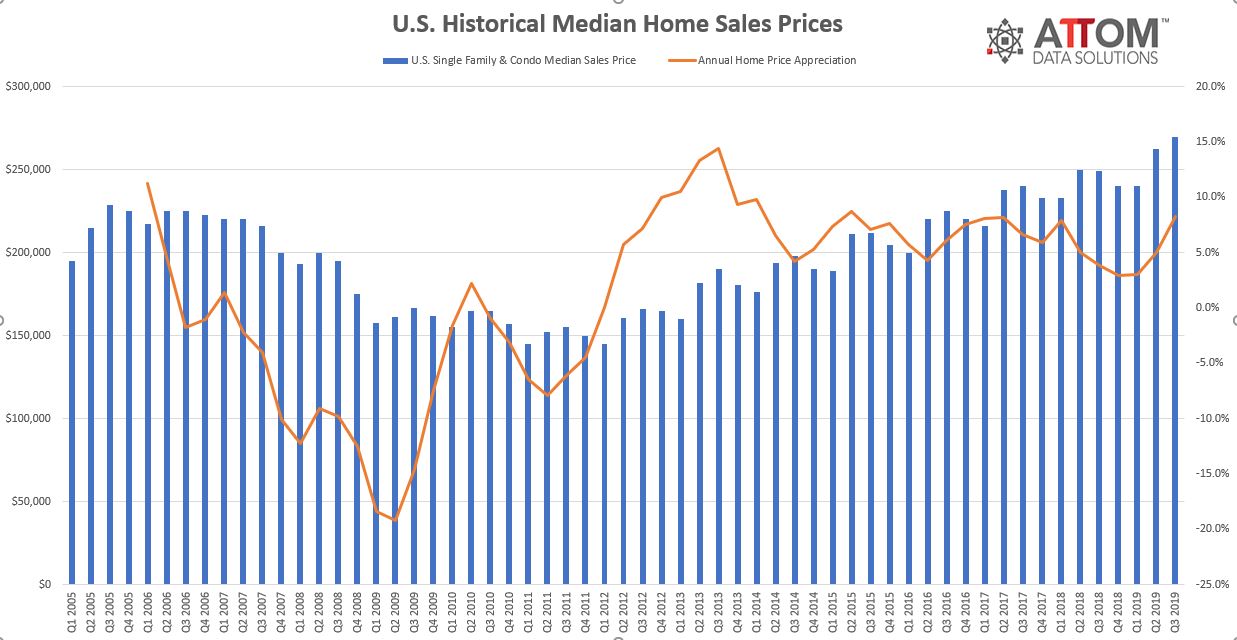
U.S. Homes Prices Jump to Record High in Q3
Home Prices Increase in 95 Percent of Local Markets
According to ATTOM Data Solutions Q3 2019 U.S. Home Sales Report, which shows that single-family homes and condos sold for a median price of $270,000 in the third quarter, up 2.9 percent from the previous quarter and up 8.3 percent from a year ago -- reaching a new high.
Meanwhile, the report shows that homeowners who sold in the third quarter earned a median profit that ticked up to a post-recession high of 34.5 percent, up from 34.4 percent in Q2 2019 and 34.3 percent from Q3 2018.
Average homeownership tenure hit a new high of 8.19 years, up 3 percent from last quarter and up 3 percent from Q3 2018. Homeownership tenure averaged 4.20 years nationwide between Q1 2000 and Q3 2007, prior to the Great Recession.
"The seven-year U.S. housing boom is back in high gear. After a series of relatively small price increase quarters, home prices saw quite the uptick, seller profits rose and the problem of distressed sales continued to fade, helping to make the third quarter the strongest in four years," said Todd Teta, chief product officer at ATTOM Data Solutions. "That all happened as mortgage rates sank back to near-historic lows, which clearly powered the market upward along with stock market surges and a continued strong economy. There had been signs before the latest surge of a cooling market, but they seem to have diminished, at least for now."
Annual home prices rising in major markets
Median home prices increased year-over-year in 148 of the 155 metro areas analyzed in the report (95 percent) in the third quarter of 2019, led by Lansing, MI (25.1 percent increase); Green Bay, WI (18.1 percent increase); Johnson City, TN (16.7 percent increase); Hickory-Lenoir-Morganton, NC (13.7 percent increase) and Spokane, WA (13.5 percent increase).
Metro areas with at least 1 million people that saw the greatest annual home price appreciation in the third quarter of 2019 included Philadelphia, PA (12.3 percent increase); Jacksonville, FL (10.8 percent increase); Detroit, MI (10.6 percent increase); Salt Lake City, UT (9.8 percent increase) and Milwaukee, WI (9.8 percent increase).
Only three major metros saw annual price drops: Kansas City, MO-KS (9.4 percent decrease); San Jose, CA (3.3 percent decrease) and Hartford, CT (0.3 percent decrease).
Prices in four of every five metros now above pre-recession peaks
Median home prices in 122 of the 155 metro areas analyzed in the report (79 percent) were above pre-recession peaks in the third quarter of 2019, led by Kennewick, WA (99 percent above); Greeley, CO (89 percent above); Shreveport, LA (84 percent above); Denver, CO (79 percent above) and Nashville, TN (75 percent above).
Metro areas other than Denver and Nashville with at least 1 million people and Q3 2019 median home prices at least 50 percent above pre-recession levels included Dallas-Fort Worth, TX (73 percent above); Austin, TX (73 percent above); San Antonio, TX (62 percent above); Houston, TX (55 percent above) and Oklahoma City, OK (52 percent above).
Average home seller gains continue to increase
U.S. homeowners who sold in the third quarter of 2019 realized an average home price gain since purchase of $68,686, up from an average gain of $66,995 in Q2 2019 and up from an average gain of $63,750 in Q3 2018. The average home seller gain of $68,686 in Q3 2019 represented an average 34.5 percent return as a percentage of original purchase price.
Among the 164 metropolitan statistical areas analyzed, those with the highest average home seller returns in Q3 2019 were San Jose, CA (82.2 percent); San Francisco, CA (72.0 percent); Seattle, WA (64.9 percent); Salem, OR (60.6 percent) and Salt Lake City, UT (59.6 percent).
Average homeownership tenure rises to new high
The average amount of time homeowners stayed in their homes before selling rose to a new high of 8.19 years in Q3 2019 - more than twice what it was during the last real estate boom in the early- and mid-2000s. The latest tenure figure was up from 7.97 years in the second quarter of 2019 and 7.94 years in Q3 2018. Among 108 metro areas analyzed in the report, 61 percent increased annually and 39 percent decreased annually.
Among major metropolitan areas with a population of at least 1 million, the longest average homeownership tenures were in Hartford, CT (12.43 years); San Jose, CA (10.92 years); Providence, RI (10.75 years); San Francisco, CA (10.67 years) and Boston, MA (10.60 years).
Share of cash sales drops to 12-year low
All-cash sales represented 24.3 percent of all single family and condo sales in Q3 2019 - the lowest level since the third quarter of 2007. The latest figure was down from 24.5 percent of all sales in the previous quarter and from 26.3 percent of all sales in Q3 2018.
Among 53 major metropolitan areas with a population of at least 1 million, those with the highest share of all-cash sales in Q3 2019 were Miami, FL (37.7 percent); Birmingham, AL (36.0 percent); Phoenix, AZ (35.1 percent); Tampa-St. Petersburg, FL (34.9 percent) and Jacksonville, Florida (33.4 percent).
Institutional investor sales share holds steady compared to a year ago
The share of U.S. single family home and condo sales made to institutional investors (entities buying at least 10 properties in a calendar year) was 3.0 percent in the third quarter of 2019, up from 2.3 percent in the previous quarter, but the same as the 3.0 percent figure from a year ago.
Among metro areas with a population of at least 1 million and at least 50 institutional investor sales in Q3 2019, those with the highest share of institutional investor sales in the third quarter were Atlanta, GA (10.5 percent); Raleigh, NC (9.6 percent); Charlotte, NC (9.2 percent); Memphis, TN (9.0 percent) and Phoenix, AZ (7.9 percent)
FHA buyers' share rises to highest point since 2017
Sales to FHA buyers (typically first-time homebuyers or other buyers with a low-down payment) represented 12.1 percent of all U.S. single family and condo sales in Q3 2019, up from 11.7 percent of all sales in the previous quarter and 10.4 percent in Q3 2018. The latest figure is the highest since Q4 2017.
Among metro areas with a population of at least 1 million, those with the highest share of sales to FHA buyers were Riverside, CA (20.5 percent); San Antonio, TX (20.2 percent); Houston, TX (19.1 percent); Dallas, TX (18.2 percent) and Indianapolis, IN (18.0 percent).
Distressed sales as a share of all transactions drop to lowest point in nearly 13 years
Total distressed sales -- bank-owned (REO) sales, third-party foreclosure auction sales, and short sales -- accounted for 10.5 percent of all single family and condo sales in Q3 2019, down from 11.3 percent in the previous quarter and from 11.6 percent from the same time last year. Distressed sales as a portion of all sales now stands at its lowest point since the fourth quarter of 2006.
The percentage decreased year-over-year in 116 of 144 (81 percent) of metropolitan statistical areas with a population of at least 200,000 and at least 100 total distressed sales in Q3 2019.
Major metro areas with a population of at least 1 million people and the highest distressed-sale percentages in the third quarter were Hartford, CT (17.2 percent of all sales); Baltimore, MD (16.7 percent); Cleveland, OH (16.1 percent); Providence, RI (15.8 percent) and Memphis, TN (15.5 percent).
Real Estate Listings Showcase


This website uses cookies to improve user experience. By using our website you consent in accordance with our Cookie Policy. Read More