The WPJ
Residential Real Estate News


Miami Leads Nation in Home Flipping
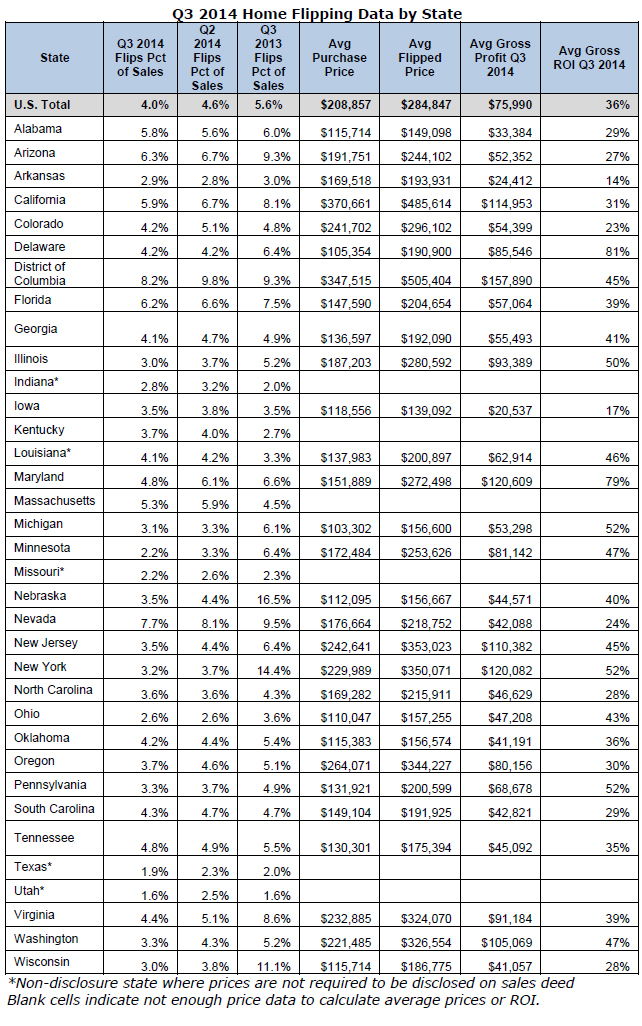
According to RealtyTrac's Q3 2014 U.S. Home Flipping Report, 26,947 single family homes were flipped nationwide in the third quarter of 2014, representing 4.0 percent of all U.S. single family home sales. This was down from 4.6 percent in the second quarter of 2014 and down from 5.6 percent in the third quarter of 2013 to the lowest level since the second quarter of 2009. Flipping is defined as when a home is purchased and subsequently sold again within 12 months
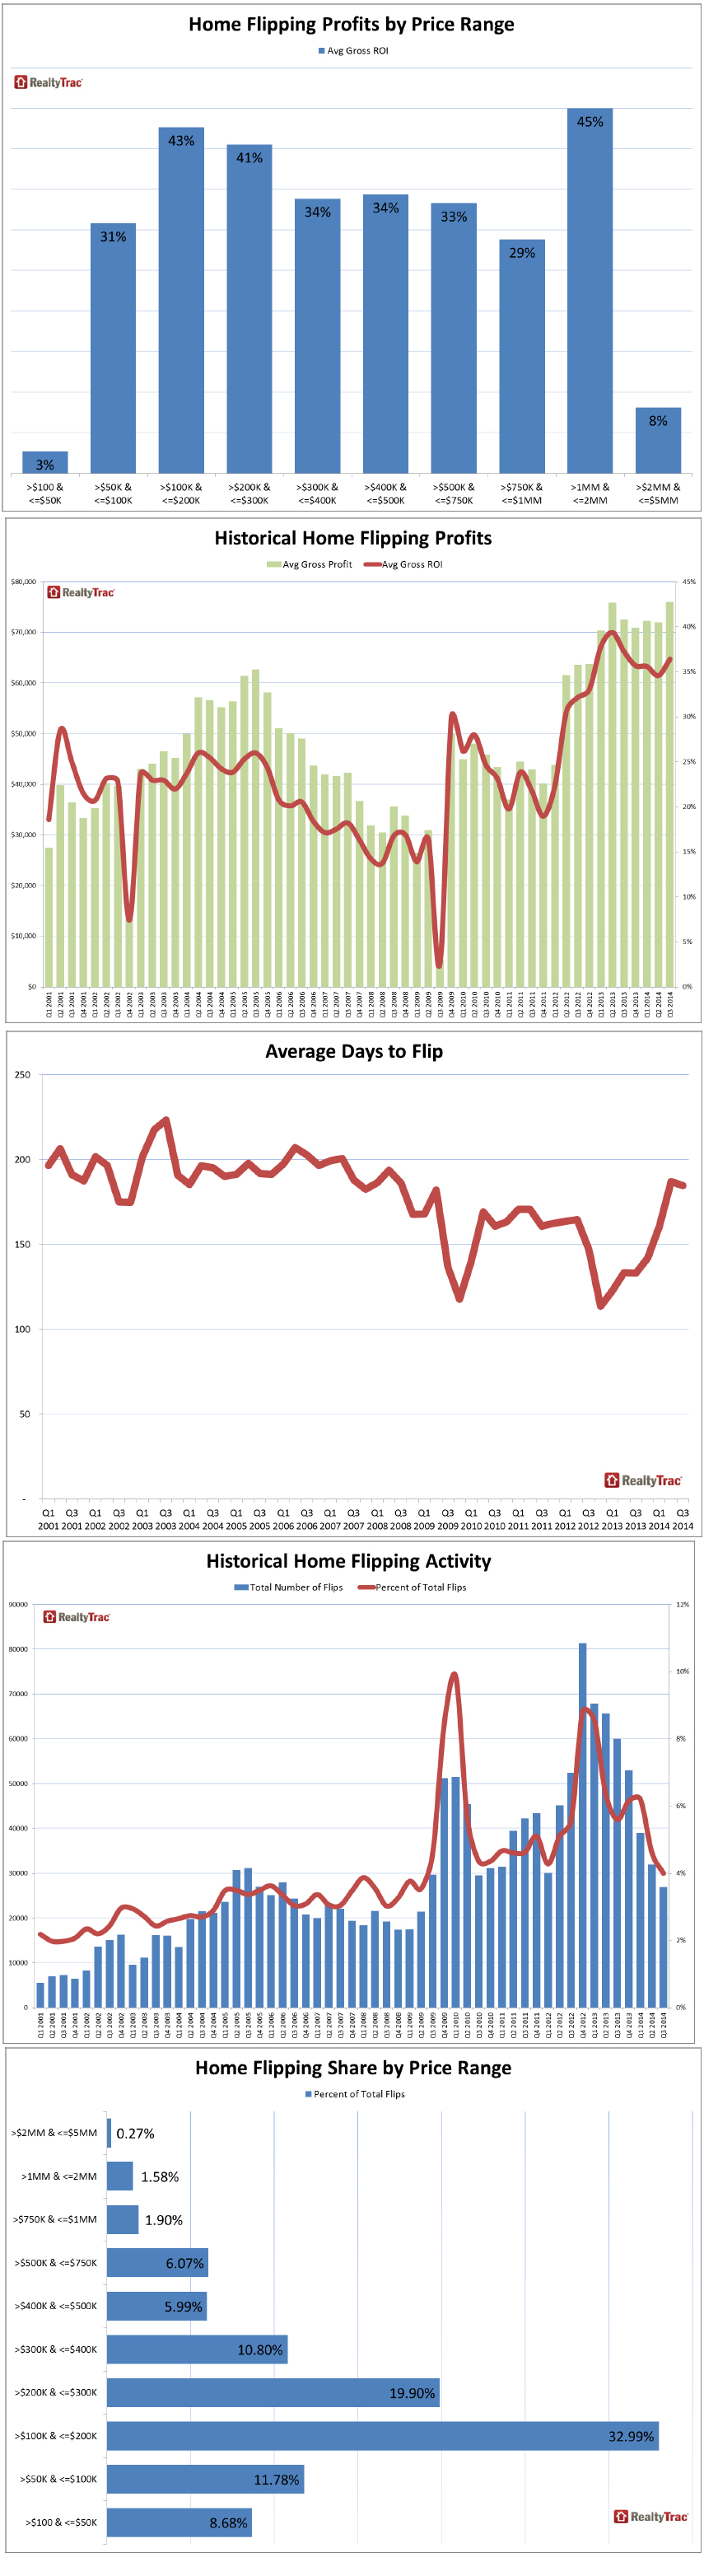
Investors averaged a gross profit of $75,990 per flip on homes flipped in the third quarter of 2014, a 36 percent gross return on the initial investment -- not including rehab costs and other expenses. The average gross return was up from 35 percent in the second quarter but down from 37 percent a year ago.
"Flipping returned to its historic norm of 4 percent in the third quarter as home price appreciation cooled in many of the hot flipping markets across the country," said Daren Blomquist, vice president at RealtyTrac. "Meanwhile, the record-high average profits per flip in the quarter demonstrate that flippers are still filling an important niche in an aging housing market with historically low levels of new homes being built. The most successful flippers are buying older, outdated homes in established neighborhoods and rehabbing them extensively to appeal to modern tastes.
"The markets with an increase in flipping tend to be those with older, distressed, inventory still available that flippers can often buy at a discount and add value to," Blomquist continued. "Those discounted distressed properties have become harder to find, but a recent jump in scheduled foreclosure auctions could provide more fodder for flippers in the next three to six months."
Other high-level findings in the report:
- Metro areas with the most flips in the third quarter were Miami (1,190 flips), Los Angeles (1,170 flips), Phoenix (1,147 flips), New York (1,070 flips) and Tampa (789 flips). Among these top five, Tampa was the only to post an increase in the share of home flips compared to a year ago.
- Metros with an increasing share of home flips compared to a year ago included Louisville, Ky. (up 117 percent), Kansas City (up 66 percent), Boston (up 40 percent), New Orleans (up 38 percent), and Indianapolis (up 35 percent).
- Markets with the best return on flips in the third quarter included Baltimore (88 percent), Pittsburgh (79 percent), Detroit (61 percent), Richmond, Va. (60 percent) and Mobile, Ala. (59 percent).
- Metros with the highest dollar amount of average gross profit on home flips included San Francisco, San Jose, Los Angeles, New York, Seattle and San Diego, all of which had an average gross profit of more than $125,000 per flip.
- Flips completed in the third quarter took an average of 185 days to complete, down slightly from 187 days in the previous quarter but up from an average of 133 days for flips completed in the third quarter of 2013.
- Homes priced below $100,000 represented 20 percent of all homes flipped during the quarter, up from 19 percent of all sales in the second quarter and up from 18 percent of all sales in the third quarter of 2013.
- Homes priced $100,000 to $400,000 represented 64 percent of all homes flipped during the quarter, down from 65 percent of all flips a year ago, while homes with a flipped price of $400,000 to $750,000 represented 12 percent of all flips, down from 13 percent a year ago. Flips on homes priced above $750,000 accounted for nearly 4 percent of all flips in the third quarter, down slightly from a year ago.
- The best returns on homes flipped in the third quarter were on homes with a flipped sale price between $1 million and $2 million, yielding a 45 percent average gross return on investment. Homes in the $100,000 to $200,000 price range had the second best return at 43 percent followed by homes in the $200,000 to $300,000 price range with an average gross return of 41 percent.
- Homes built before 1990 accounted for 73 percent of all home flips in the third quarter, up from 69 percent of all homes flipped a year ago. Homes built from 1990 to 1999 accounted for 10 percent of all homes flipped in the third quarter, while homes built in 2000 or later accounted for 17 percent of all homes flipped in the third quarter.
- Homes built from 1930 to 1939 yielded a 53 percent gross return on investment for flips in the third quarter, the highest gross return of any decade going back to 1930. Homes built from 1950 to 1959 came in second with a 47 percent return.
Real Estate Listings Showcase


This website uses cookies to improve user experience. By using our website you consent in accordance with our Cookie Policy. Read More