Residential Real Estate News


U.S. Housing Inventory Crunch Accelerated in July
According to Realtor.com's July Monthly Housing Trends Report, the U.S. housing inventory crunch accelerated in July as active listings growth slowed for the fourth month in a row and fell below year ago levels (-6.4%) for the first time since April 2022.
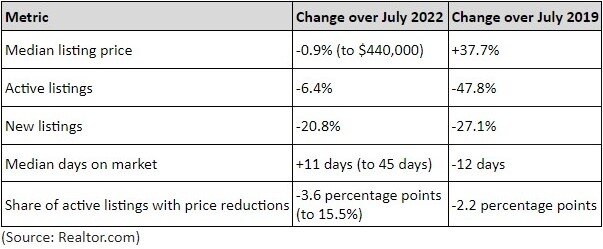
While buyers had fewer for-sale options, with active inventory 49.2% below typical pre-pandemic July levels, the market tipped slightly in their favor as the median list price declined year over year (-0.9% to $440,000) for the second month in a row.
"While a second monthly year-over-year decline in list prices bodes well for potential buyers, the ongoing lack of homes available for sale continues to prop up home prices and will keep declines relatively modest for the remainder of the year," said Danielle Hale, Chief Economist for Realtor.com. "Interest rate hikes continue to further cut into buyers' purchasing power, although they appear to have adapted to the higher mortgage rate environment faster than sellers, many of whom are still on the sidelines, locked in to lower interest rates and unwilling to cash in their home's equity to purchase another. That's putting a damper on home sales, which will likely post their smallest annual tally this year in over a decade."
July 2023 Housing Metrics - National
Home listing inventory crunch intensifies as fewer sellers enter the market
Growth in the U.S. inventory of active listings slowed for four months in a row, and in July, declined compared to the previous year for the first time since early 2022. That means today's buyers have significantly fewer options to choose from compared to one year ago - on a typical day in July there were 45,000 fewer homes available to buy. With interest rates on track to remain elevated for the remainder of the year and homeowners choosing to sell in lower numbers than has been typical in recent years, the stock of homes for sale is expected to remain low in the coming months.
- In July, the U.S. inventory of active listings slowed for the fourth month in a row and decreased -6.4% compared to July 2022; the decline was the first since April 2022. Inventory is 49.2% below typical July pre-pandemic levels.
- Both newly listed homes (-20.8%) and pending listings (-12.6%), or homes under contract, declined year over year. July's decline in pending listings is smaller than June's -16.7% decline and much improved from December's peak decline (-36.9% year over year).
- Active inventory decreased in 38 out of 50 of the largest metros compared to last year. Only the Southern region saw inventory grow, up +2.8% year over year, led by New Orleans (+39.6%), San Antonio (+34.5%) and Memphis, Tenn. (+33.2%).
- In July, none of the 50 largest metro areas saw new listings increase over the previous year. Declines were greatest in Phoenix(-44.3%) Seattle (-38.4%) and San Jose, Calif. (-35.3%).
Home listing prices decline but mortgage rates keep purchase costs high
In July, national median list prices declined slightly year over year for the second month in a row. Despite the dip, the low supply of homes for sale and a resilient labor market are expected to keep upward pressure on prices this year, as will still-high buyer demand. The housing market continues to generally move faster than it did in the pre-pandemic era despite significant slowing from the frenzied pace of the past few years; while time on market is up slightly from last year, the share of homes with price reductions is down from last July.
- For the second month in a row, the U.S. median list price declined slightly (-0.9% year over year) to $440,000 in July, down from $445,000 in June. The median list price is down -2.0% from its record high of $449,000 in June 2022.
- Higher mortgage rates compared to July of last year increased the monthly cost of financing 80% of the typical home by roughly $346 (+17.5%) compared to a year ago.
- Nationally, the share of homes with price reductions decreased from 19.1% in July 2022 to 15.5% this year. The share of price reductions remains below typical levels seen in 2017 to 2019.
- The typical home spent 45 days on market in June, 11 days longer than this time last year, but 12 fewer days than they typically did in the average June 2017-2019.
- Across the 50 largest U.S. metros, in July the typical home spent 39 days on the market, 8 days more than the previous July. Time on market increased the most in Miami (+24 days), Austin, Texas (+20 days), San Antonio (+19 days), and Raleigh, N.C. (+19 days)
Spotlight On: A rising number of buyers are looking for homes in other markets
With rising rates and still-high home prices, the number of home shoppers searching for homes in areas other than where they live continues to rise. Realtor.com's Q2 Cross-Market Demand Report, also released today, found that Western shoppers are most likely to look for out-of-market homes, but Northeastern shoppers are catching up - that region saw the highest growth this quarter. While home shoppers show the greatest preference for searching for homes in nearby metros or states, long-distance home searching sometimes pairs unexpected cities, such as from San Francisco to Chicago and Chicago to Dallas.
- In Q2 2023, 60.3% of all Realtor.com listing views from the Top 100 metros went to homes located outside the metro areas where shoppers live, up 0.7 percentage points from Q1 2023 and 4.1 percentage points year over year.
- Regionally, Western home shoppers (67.7%) were most likely to look for out-of-market homes in Q2, but Northeastern shoppers (59.9%) are catching up. Northeastern shoppers saw the highest growth in Q2, when the share of out-of-market shopping was 5.5 percentage points higher than the prior year.
- In all four regions, more than half of online shopping traffic went to homes outside of the shoppers' metro areas. Only the Western region had this level of outside shopping interest three years ago.
- Chicago has been the top out-of-state destination for home shoppers based in San Francisco for the past four quarters, likely because of its relatively affordable housing, similar tech/industry structure and easy access to transportation. Similarly, Dallas serves as the metro pair for Chicago for shoppers seeking tech jobs, easy air transportation and warmer weather.
- Tampa, Fla. is a metro pair for multiple metros in New York and Ohio, including Akron, Cincinnati and Cleveland in Ohio and Buffalo, Rochester and Syracuse in New York. Las Vegas is urban Honolulu's metro pair, Phoenix is Portland, Ore.'s metro pair, and Miami is New York City's metro pair.
"Housing affordability isn't likely to improve anytime soon, so it's not surprising to see that Americans are on the move and increasingly searching for homes in more affordable areas of the country where they can stretch their housing dollars further," said Jiayi Xu, Realtor.com Economist. "Sellers are much more likely to see interest from out-of-towners than in years past, and from where that interest is coming might be the most surprising."


